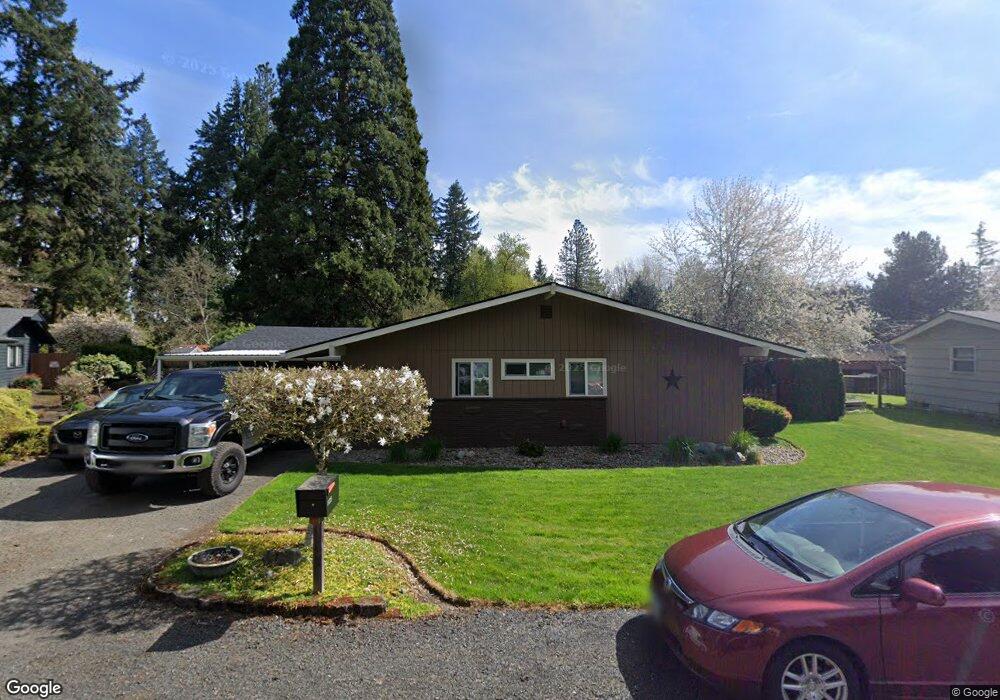
1125 NW Green Acres Loop Albany, OR 97321
North Albany NeighborhoodEstimated Value: $509,000 - $591,000
3
Beds
2
Baths
2,285
Sq Ft
$241/Sq Ft
Est. Value
About This Home
This home is located at 1125 NW Green Acres Loop, Albany, OR 97321 and is currently estimated at $549,788, approximately $240 per square foot. 1125 NW Green Acres Loop is a home located in Benton County with nearby schools including North Albany Elementary School, North Albany Middle School, and West Albany High School.
Ownership History
Date
Name
Owned For
Owner Type
Purchase Details
Closed on
Aug 1, 2003
Sold by
Richey Chad
Bought by
Richey Chad and Richey Lori A
Current Estimated Value
Purchase Details
Closed on
Oct 21, 2002
Sold by
Richey Chad and Richey Lori A
Bought by
Richey Chad
Home Financials for this Owner
Home Financials are based on the most recent Mortgage that was taken out on this home.
Original Mortgage
$137,000
Outstanding Balance
$57,142
Interest Rate
6.09%
Estimated Equity
$492,646
Purchase Details
Closed on
Aug 29, 2001
Sold by
Richey Chad
Bought by
Richey Chad and Richey Lori A
Purchase Details
Closed on
Apr 4, 2001
Sold by
Meuler Dennis R
Bought by
Richey Chad
Home Financials for this Owner
Home Financials are based on the most recent Mortgage that was taken out on this home.
Original Mortgage
$129,980
Interest Rate
7.19%
Purchase Details
Closed on
Oct 20, 1999
Sold by
Elizabeth K Meuler Revocable Living Tr
Bought by
Meuler Dennis R
Create a Home Valuation Report for This Property
The Home Valuation Report is an in-depth analysis detailing your home's value as well as a comparison with similar homes in the area
Home Values in the Area
Average Home Value in this Area
Purchase History
| Date | Buyer | Sale Price | Title Company |
|---|---|---|---|
| Richey Chad | -- | Key Title Company | |
| Richey Chad | -- | Key Title Company | |
| Richey Chad | -- | First American | |
| Richey Chad | $134,000 | First American | |
| Meuler Dennis R | $150,940 | -- |
Source: Public Records
Mortgage History
| Date | Status | Borrower | Loan Amount |
|---|---|---|---|
| Open | Richey Chad | $137,000 | |
| Closed | Richey Chad | $129,980 |
Source: Public Records
Tax History Compared to Growth
Tax History
| Year | Tax Paid | Tax Assessment Tax Assessment Total Assessment is a certain percentage of the fair market value that is determined by local assessors to be the total taxable value of land and additions on the property. | Land | Improvement |
|---|---|---|---|---|
| 2024 | $5,331 | $283,319 | -- | -- |
| 2023 | $5,024 | $275,067 | $0 | $0 |
| 2022 | $4,948 | $267,055 | $0 | $0 |
| 2021 | $4,686 | $259,277 | $0 | $0 |
| 2020 | $4,743 | $251,725 | $0 | $0 |
| 2019 | $4,475 | $244,393 | $0 | $0 |
| 2018 | $4,495 | $237,275 | $0 | $0 |
| 2017 | $4,364 | $230,364 | $0 | $0 |
| 2016 | $4,039 | $223,654 | $0 | $0 |
| 2015 | $3,727 | $217,140 | $0 | $0 |
| 2014 | $3,691 | $210,816 | $0 | $0 |
| 2012 | -- | $198,715 | $0 | $0 |
Source: Public Records
Map
Nearby Homes
- 347 Benton Dr NW
- 112 NE Green Ct
- 910 Troon St NW
- 1216 NE Montgomery Place
- 885 N Pointe Dr NW
- 1350 Springhill Dr NW
- 645 NW East Thornton Lake Dr
- 653 NW East Thornton Lake Dr
- 1141 NE Springwood Dr
- 153 NE Peachtree Ln
- 334 NE 13th Ave
- 580 NW Quarry Rd
- 2302 Imperial Dr NW
- 1610 NW Springhill Dr
- 1345 NW Laurel Heights Dr
- 0 NW Miller Ln Unit 265166147
- 2291 (Lot 27) NW Delene Ct
- 2270 (Lot 17) NW Delene Ct
- 2262 (lot 18) NW Delene Ct
- 2283 (Lot 26) NW Delene Ct
- 1135 NW Green Acres Loop
- 1115 NW Green Acres Loop
- 1120 NW Cottonwood Ln
- 1110 NW Cottonwood Ln
- 1114 NW Green Acres Loop
- 1143 NW Green Acres Loop
- 1151 NW Green Acres Loop
- 245 NW Green Acres Ln
- 1117 NW Cottonwood Ln
- 311 NW Green Acres Ln
- 321 NW Green Acres Ln
- 1120 NW Shady Ln
- 1220 NW Shady Ln
- 1130 NW Shady Ln
- 1101 NW Cottonwood Ln
- 1230 NW Shady Ln
- 1159 NW Green Acres Loop
- 1110 NW Shady Ln
- 203 Green Acres Ln NW
- 329 Green Acres Ln NW