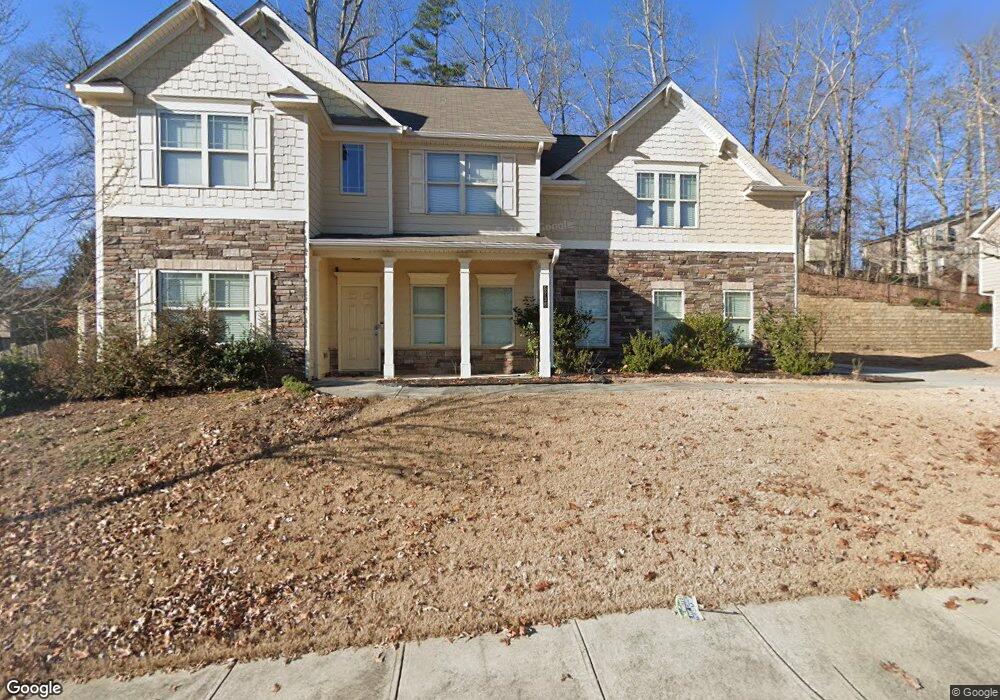
1125 Riverside Rd Sugar Hill, GA 30518
Estimated Value: $326,000 - $346,000
3
Beds
3
Baths
1,250
Sq Ft
$269/Sq Ft
Est. Value
About This Home
This home is located at 1125 Riverside Rd, Sugar Hill, GA 30518 and is currently estimated at $336,315, approximately $269 per square foot. 1125 Riverside Rd is a home located in Gwinnett County with nearby schools including Sycamore Elementary School, Lanier Middle School, and Lanier High School.
Ownership History
Date
Name
Owned For
Owner Type
Purchase Details
Closed on
Sep 26, 2019
Sold by
Sfr Jv 1 Property Llc
Bought by
Sfr Jv 1 2019 1 Borrower Llc
Current Estimated Value
Purchase Details
Closed on
Jul 6, 2018
Sold by
Murray Maria Annette Thompso
Bought by
Sfr Jv 1 Property Llc
Purchase Details
Closed on
Apr 19, 2013
Sold by
Murray Stephen
Bought by
Murray Maria Annette
Home Financials for this Owner
Home Financials are based on the most recent Mortgage that was taken out on this home.
Original Mortgage
$66,600
Interest Rate
3.59%
Mortgage Type
New Conventional
Purchase Details
Closed on
Feb 21, 2003
Sold by
Rhodes Trust
Bought by
Murray Stephen and Murray Annette
Home Financials for this Owner
Home Financials are based on the most recent Mortgage that was taken out on this home.
Original Mortgage
$95,631
Interest Rate
5.95%
Purchase Details
Closed on
Mar 5, 1997
Sold by
Southeastern Housing Foundation
Bought by
Rhodes James S Ann C
Create a Home Valuation Report for This Property
The Home Valuation Report is an in-depth analysis detailing your home's value as well as a comparison with similar homes in the area
Home Values in the Area
Average Home Value in this Area
Purchase History
| Date | Buyer | Sale Price | Title Company |
|---|---|---|---|
| Sfr Jv 1 2019 1 Borrower Llc | -- | -- | |
| Sfr Jv 1 Property Llc | $169,000 | -- | |
| Murray Maria Annette | -- | -- | |
| Murray Stephen | $120,700 | -- | |
| Rhodes James S Ann C | $100,000 | -- |
Source: Public Records
Mortgage History
| Date | Status | Borrower | Loan Amount |
|---|---|---|---|
| Previous Owner | Murray Maria Annette | $66,600 | |
| Previous Owner | Murray Stephen | $95,631 | |
| Closed | Rhodes James S Ann C | $0 |
Source: Public Records
Tax History Compared to Growth
Tax History
| Year | Tax Paid | Tax Assessment Tax Assessment Total Assessment is a certain percentage of the fair market value that is determined by local assessors to be the total taxable value of land and additions on the property. | Land | Improvement |
|---|---|---|---|---|
| 2025 | $441 | $115,760 | $26,000 | $89,760 |
| 2024 | $4,040 | $115,760 | $26,000 | $89,760 |
| 2023 | $4,040 | $119,360 | $26,000 | $93,360 |
| 2022 | $2,818 | $80,520 | $14,400 | $66,120 |
| 2021 | $2,875 | $80,520 | $14,400 | $66,120 |
| 2020 | $3,237 | $80,520 | $14,400 | $66,120 |
| 2019 | $2,629 | $67,600 | $14,400 | $53,200 |
| 2018 | $2,100 | $65,560 | $12,000 | $53,560 |
| 2016 | $1,762 | $52,240 | $12,000 | $40,240 |
| 2015 | $1,589 | $45,400 | $8,000 | $37,400 |
| 2014 | -- | $45,400 | $8,000 | $37,400 |
Source: Public Records
Map
Nearby Homes
- 5680 Princeton Oaks Dr
- 5650 Princeton Oaks Dr
- 5757 Riverside Dr Unit 2
- 5683 Riverside Walk Dr
- 1275 Riverside Rd
- 5880 April Dr Unit 1
- 915 Riverside Rd Unit 3
- 1114 Danube Trail
- 5671 Arbor Green Cir
- 1025 Hunters Oak Trail
- 5800 S Richland Creek Rd
- 5660 Winter Bluff Way
- 5689 Winter Bluff Way
- 965 Sugar Meadow Dr
- 978 Sugar Vista Cir
- 5730 Arbor Green Cir
- 1150 Sycamore Creek Trail
- 5738 Riverside Bay
- 0 Riverside Bay Unit 8594955
- 0 Riverside Bay Unit 8571872
- 0 Riverside Bay
- 5728 Riverside Bay
- 5748 Riverside Bay
- 5735 Riverside Bay Unit 11
- 5735 Riverside Bay Unit BAY
- 5735 Riverside Bay
- 5735 Princeton Oaks Dr Unit 1
- 5735 Riverside Bay
- 5745 Princeton Oaks Dr
- 5725 Princeton Oaks Dr
- 5745 Riverside Bay Unit 12
- 5745 Riverside Bay Unit BAY
- 5745 Riverside Bay
- 5745 Riverside Bay
- 5725 Riverside Bay Unit 10
- 5725 Riverside Bay Unit BAY
- 5755 Princeton Oaks Dr Unit 5755