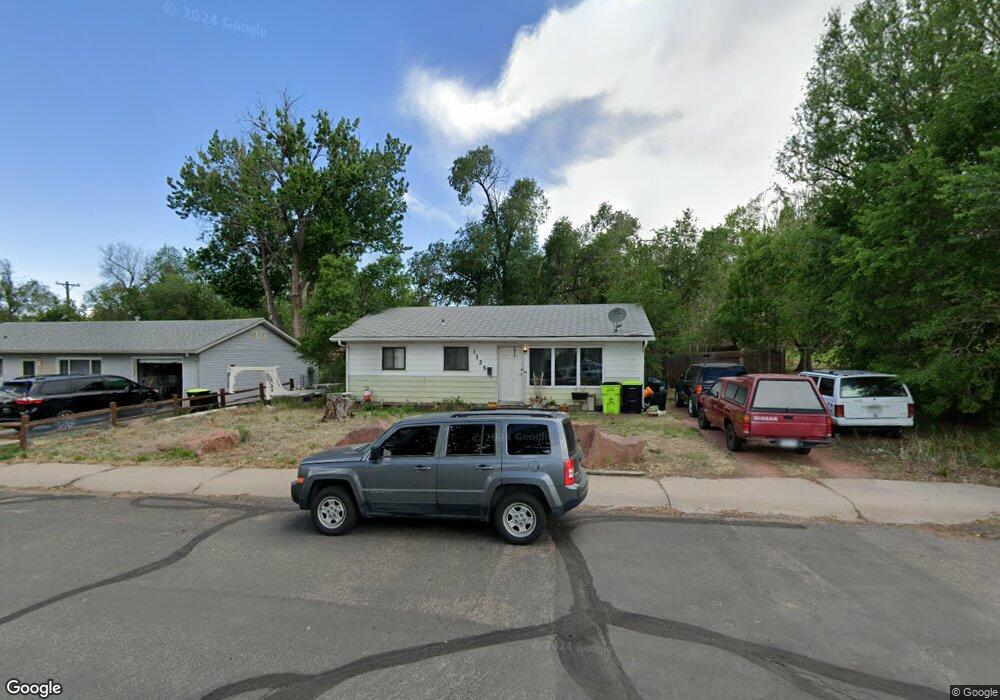
1125 Rockwood Ave Colorado Springs, CO 80905
Stratton Meadows NeighborhoodEstimated Value: $274,046 - $291,000
2
Beds
1
Bath
894
Sq Ft
$315/Sq Ft
Est. Value
About This Home
This home is located at 1125 Rockwood Ave, Colorado Springs, CO 80905 and is currently estimated at $282,012, approximately $315 per square foot. 1125 Rockwood Ave is a home located in El Paso County with nearby schools including Stratton Meadows Elementary School, Fox Meadow Middle School, and Harrison High School.
Ownership History
Date
Name
Owned For
Owner Type
Purchase Details
Closed on
Jun 2, 2010
Sold by
Jc/Dc Enterprises
Bought by
Karma Phantom 99 Inc
Current Estimated Value
Purchase Details
Closed on
Aug 8, 2005
Sold by
Cole Jeffrey A and Cole Donna M
Bought by
Jc Dc Enterprises
Purchase Details
Closed on
Mar 25, 2005
Sold by
Dalebout Laura Sue
Bought by
Cole Jeffrey A and Cole Donna M
Home Financials for this Owner
Home Financials are based on the most recent Mortgage that was taken out on this home.
Original Mortgage
$79,120
Interest Rate
6.87%
Mortgage Type
Unknown
Purchase Details
Closed on
Feb 26, 1996
Sold by
Blunt Robert A and Blunt Crystal
Bought by
Dalebout Laura Sue
Home Financials for this Owner
Home Financials are based on the most recent Mortgage that was taken out on this home.
Original Mortgage
$73,824
Interest Rate
7.01%
Mortgage Type
FHA
Purchase Details
Closed on
Oct 1, 1985
Bought by
Karma Phantom 99 Inc
Create a Home Valuation Report for This Property
The Home Valuation Report is an in-depth analysis detailing your home's value as well as a comparison with similar homes in the area
Home Values in the Area
Average Home Value in this Area
Purchase History
| Date | Buyer | Sale Price | Title Company |
|---|---|---|---|
| Karma Phantom 99 Inc | -- | None Available | |
| Jc Dc Enterprises | -- | None Available | |
| Cole Jeffrey A | $98,900 | Fahtco | |
| Dalebout Laura Sue | $74,000 | -- | |
| Karma Phantom 99 Inc | -- | -- |
Source: Public Records
Mortgage History
| Date | Status | Borrower | Loan Amount |
|---|---|---|---|
| Previous Owner | Cole Jeffrey A | $79,120 | |
| Previous Owner | Dalebout Laura Sue | $73,824 | |
| Closed | Cole Jeffrey A | $19,780 |
Source: Public Records
Tax History Compared to Growth
Tax History
| Year | Tax Paid | Tax Assessment Tax Assessment Total Assessment is a certain percentage of the fair market value that is determined by local assessors to be the total taxable value of land and additions on the property. | Land | Improvement |
|---|---|---|---|---|
| 2025 | $933 | $20,630 | -- | -- |
| 2024 | $701 | $19,960 | $3,030 | $16,930 |
| 2022 | $693 | $12,850 | $2,430 | $10,420 |
| 2021 | $740 | $13,220 | $2,500 | $10,720 |
| 2020 | $676 | $10,380 | $2,150 | $8,230 |
| 2019 | $656 | $10,380 | $2,150 | $8,230 |
| 2018 | $535 | $8,150 | $1,730 | $6,420 |
| 2017 | $408 | $8,150 | $1,730 | $6,420 |
| 2016 | $385 | $7,210 | $1,510 | $5,700 |
| 2015 | $385 | $7,210 | $1,510 | $5,700 |
| 2014 | $370 | $6,860 | $1,510 | $5,350 |
Source: Public Records
Map
Nearby Homes
- 916 Tenderfoot Hill Rd Unit 101
- 846 Tenderfoot Hill Rd Unit 104
- 846 Tenderfoot Hill Rd Unit 202
- 840 Tenderfoot Hill Rd
- 840 Tenderfoot Hill Rd Unit 201
- 850 Tenderfoot Hill Rd Unit 103
- 1117 Montrose Ave
- 2768 La Strada Grande Heights
- 1205 Montrose Ave
- 1216 Norwood Ave
- 1304 Pando Ave
- 1052 Florence Ave
- 2415 Byers Ave
- 1309 Florence Ave
- 1315 Pando Ave
- 1036 Florence Ave
- 1224 La Junta Ave
- 1117 Mount Werner Cir
- 1033 Mount Werner Cir
- 2127 S Corona Ave
- 1127 Rockwood Ave
- 1128 Harrison Rd
- 1129 Rockwood Ave
- 1130 Harrison Rd
- 1128 Rockwood Ave
- 1131 Rockwood Ave
- 1130 Rockwood Ave
- 1132 Harrison Rd
- 1132 Rockwood Ave
- 1133 Rockwood Ave
- 1134 Harrison Rd
- 1125 Pando Ave
- 1127 Pando Ave
- 1134 Rockwood Ave
- 1129 Pando Ave
- 1135 Rockwood Ave
- 1136 Harrison Rd
- 1131 Pando Ave
- 1036 Rockwood Ave
- 1136 Rockwood Ave