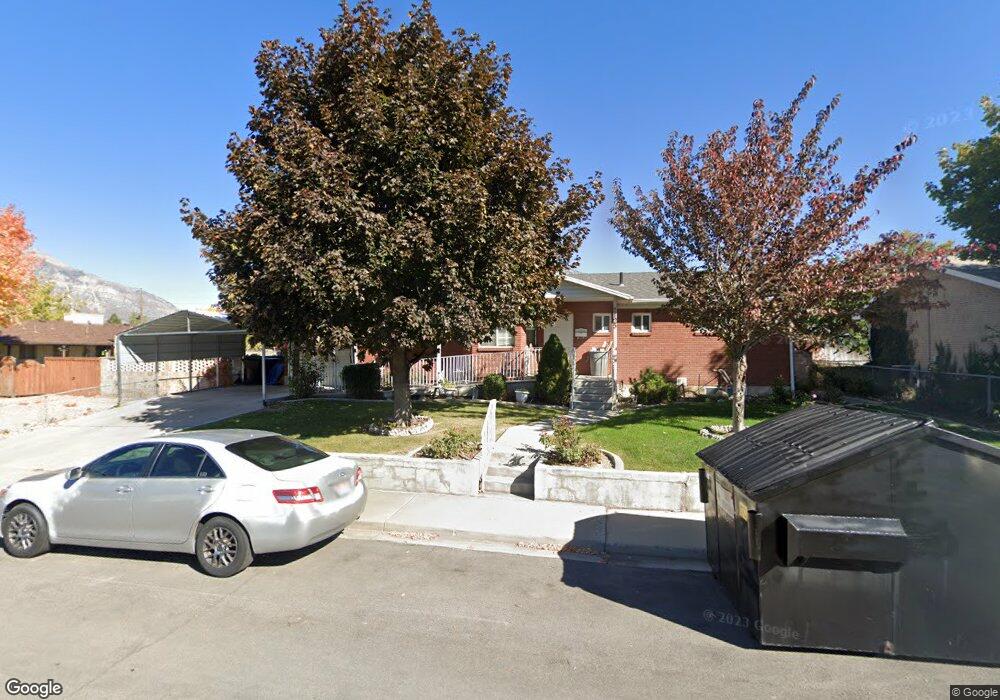
1125 S 200 W Orem, UT 84058
Westmore NeighborhoodEstimated Value: $485,000 - $546,000
5
Beds
2
Baths
1,344
Sq Ft
$379/Sq Ft
Est. Value
About This Home
This home is located at 1125 S 200 W, Orem, UT 84058 and is currently estimated at $508,713, approximately $378 per square foot. 1125 S 200 W is a home located in Utah County with nearby schools including Westmore Elementary School, Lakeridge Jr High School, and Mountain View High School.
Ownership History
Date
Name
Owned For
Owner Type
Purchase Details
Closed on
Jun 23, 2023
Sold by
Lamar Simpson Revocable Trust
Bought by
Simpson Robert L
Current Estimated Value
Home Financials for this Owner
Home Financials are based on the most recent Mortgage that was taken out on this home.
Original Mortgage
$290,000
Outstanding Balance
$282,245
Interest Rate
6.39%
Mortgage Type
New Conventional
Estimated Equity
$226,468
Purchase Details
Closed on
Jan 30, 2015
Sold by
Simpson Lamar C
Bought by
Simpson Lamar C and Lamar Simpson Revocable Trust
Create a Home Valuation Report for This Property
The Home Valuation Report is an in-depth analysis detailing your home's value as well as a comparison with similar homes in the area
Home Values in the Area
Average Home Value in this Area
Purchase History
| Date | Buyer | Sale Price | Title Company |
|---|---|---|---|
| Simpson Robert L | -- | Highland Title | |
| Simpson Lamar C | -- | Keystone Title Ins Agen |
Source: Public Records
Mortgage History
| Date | Status | Borrower | Loan Amount |
|---|---|---|---|
| Open | Simpson Robert L | $290,000 |
Source: Public Records
Tax History
| Year | Tax Paid | Tax Assessment Tax Assessment Total Assessment is a certain percentage of the fair market value that is determined by local assessors to be the total taxable value of land and additions on the property. | Land | Improvement |
|---|---|---|---|---|
| 2025 | $1,963 | $246,180 | -- | -- |
| 2024 | $1,963 | $240,075 | $0 | $0 |
| 2023 | $1,831 | $240,625 | $0 | $0 |
| 2022 | $1,921 | $244,640 | $0 | $0 |
| 2021 | $1,788 | $344,800 | $174,800 | $170,000 |
| 2020 | $1,617 | $306,500 | $139,800 | $166,700 |
| 2019 | $1,438 | $283,500 | $129,000 | $154,500 |
| 2018 | $1,327 | $249,900 | $111,100 | $138,800 |
| 2017 | $1,225 | $123,585 | $0 | $0 |
| 2016 | $1,195 | $111,155 | $0 | $0 |
| 2015 | $1,155 | $101,640 | $0 | $0 |
| 2014 | $1,063 | $93,060 | $0 | $0 |
Source: Public Records
Map
Nearby Homes
Your Personal Tour Guide
Ask me questions while you tour the home.