Estimated Value: $414,000 - $998,000
--
Bed
--
Bath
2,621
Sq Ft
$272/Sq Ft
Est. Value
About This Home
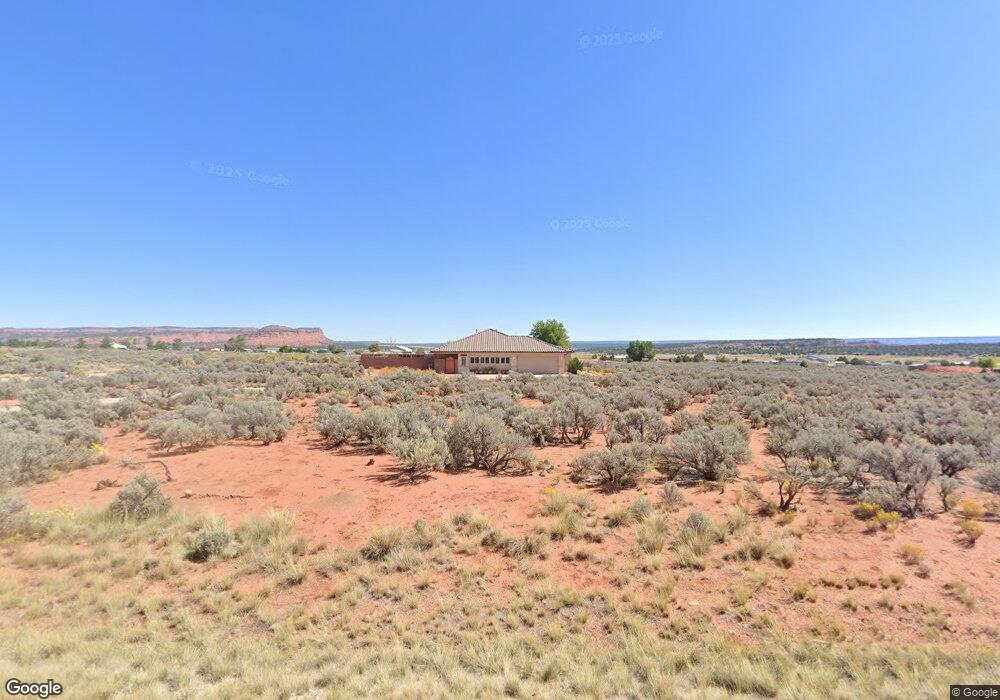
This home is located at 1125 S Kaibab Trail, Kanab, UT 84741 and is currently estimated at $713,796, approximately $272 per square foot. 1125 S Kaibab Trail is a home located in Kane County with nearby schools including Kanab Elementary School, Kanab Middle School, and Kanab High School.
Ownership History
Date
Name
Owned For
Owner Type
Purchase Details
Closed on
Apr 30, 2015
Sold by
Gretchen Estelle Gretchen Estelle
Bought by
Himmen Michael W
Current Estimated Value
Home Financials for this Owner
Home Financials are based on the most recent Mortgage that was taken out on this home.
Original Mortgage
$315,000
Outstanding Balance
$242,577
Interest Rate
3.67%
Mortgage Type
Purchase Money Mortgage
Estimated Equity
$471,219
Purchase Details
Closed on
Apr 26, 2010
Sold by
Rebold Gretchen
Bought by
Rebold Gretchen Estelle
Home Financials for this Owner
Home Financials are based on the most recent Mortgage that was taken out on this home.
Original Mortgage
$265,000
Interest Rate
4.91%
Purchase Details
Closed on
Oct 5, 2009
Sold by
Hughes James F and Hughes Teresa R
Bought by
Rebold Gretchen
Purchase Details
Closed on
Apr 27, 2009
Sold by
Hughes Teresa Rebold
Bought by
Rebold Gretchen
Purchase Details
Closed on
Nov 2, 2007
Sold by
Hughes Teresa Rebold
Bought by
Hughes James F and Hughes Teresa R
Create a Home Valuation Report for This Property
The Home Valuation Report is an in-depth analysis detailing your home's value as well as a comparison with similar homes in the area
Home Values in the Area
Average Home Value in this Area
Purchase History
| Date | Buyer | Sale Price | Title Company |
|---|---|---|---|
| Himmen Michael W | -- | -- | |
| Rebold Gretchen Estelle | -- | -- | |
| Rebold Gretchen | -- | -- | |
| Rebold Gretchen | -- | -- | |
| Hughes James F | -- | -- |
Source: Public Records
Mortgage History
| Date | Status | Borrower | Loan Amount |
|---|---|---|---|
| Open | Himmen Michael W | $315,000 | |
| Closed | Rebold Gretchen Estelle | $265,000 |
Source: Public Records
Tax History Compared to Growth
Tax History
| Year | Tax Paid | Tax Assessment Tax Assessment Total Assessment is a certain percentage of the fair market value that is determined by local assessors to be the total taxable value of land and additions on the property. | Land | Improvement |
|---|---|---|---|---|
| 2025 | $2,937 | $434,222 | $105,885 | $328,337 |
| 2024 | $2,937 | $404,002 | $86,648 | $317,354 |
| 2023 | $2,369 | $344,691 | $80,229 | $264,462 |
| 2022 | $2,452 | $319,793 | $55,331 | $264,462 |
| 2021 | $2,216 | $433,563 | $77,385 | $356,178 |
| 2020 | $2,231 | $415,918 | $87,120 | $328,798 |
| 2019 | $2,294 | $415,918 | $87,120 | $328,798 |
| 2018 | $2,219 | $401,398 | $72,600 | $328,798 |
| 2017 | $2,072 | $356,900 | $72,600 | $284,300 |
| 2016 | $2,129 | $356,900 | $72,600 | $284,300 |
| 2015 | $1,786 | $330,425 | $69,822 | $260,603 |
| 2014 | $1,786 | $295,453 | $69,822 | $225,631 |
| 2013 | -- | $172,705 | $0 | $0 |
Source: Public Records
Map
Nearby Homes
- 6026 Zion Rd
- 6026 E Zion Rd Unit 7
- 6178 E Zion Rd
- 6178 Zion Rd
- 0 E Zion: Hwy 9 Mile Post 51 Unit 22-233123
- Lot 20 Lone Spur
- Lot 19 Lone Spur
- 1250 Lone Spur Cir
- Lot 11 Lone Spur
- Lot 8 Rowel
- Lot 9 Rowel
- Lot 10 Rowel
- Lot 7 Rowel
- Lot 6 Rowel
- 35 S Sunset Dr
- Lot 5 Boulder Bluff Blvd
- Lot 3 Boulder Bluff Blvd
- Lot 4 Boulder Bluff Blvd
- Lot 2 Boulder Bluff Blvd
- Lot 1 Boulder Bluff Blvd
- * Kaibab Trail
- 19 Kaibab Trail Unit 19
- Corner S Kaibab Trail
- 1075 S Kaibab Trail
- 16 Kaibab Trail
- 1201 S Kaibab Trail
- 1066 Monument Way
- 1088 Monument Way
- 1142 Monument Way
- 951 S Kaibab Trail
- 1020 Monument Way
- 1225 S Kaibab Trail
- 1220 Monument Rd
- 1220 Monument Way
- 5905 Navajo Trail
- 1230 S Kaibab Trail
- Corner Kaibab Trail
- 0 Monument Rd
- 1147 Monument Way
- 5855 Navajo Trail