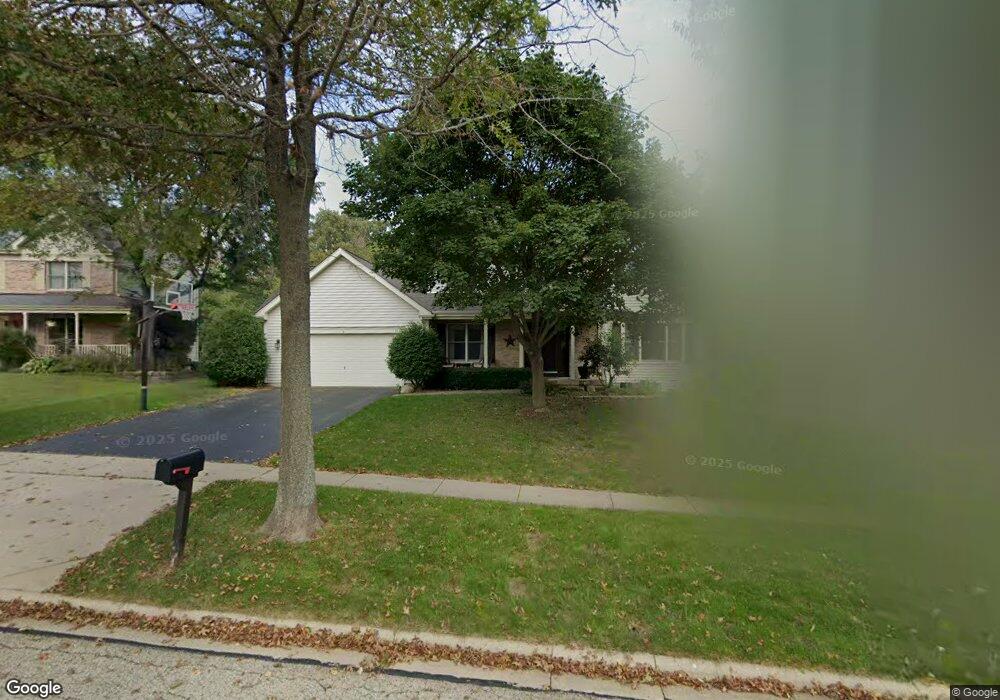
1125 Thatcher Trail Unit 2 West Dundee, IL 60118
Estimated Value: $426,481 - $477,000
4
Beds
--
Bath
2,360
Sq Ft
$194/Sq Ft
Est. Value
About This Home
This home is located at 1125 Thatcher Trail Unit 2, West Dundee, IL 60118 and is currently estimated at $458,370, approximately $194 per square foot. 1125 Thatcher Trail Unit 2 is a home located in Kane County with nearby schools including Dundee Highlands Elementary School, Dundee Middle School, and West Prairie Middle School.
Ownership History
Date
Name
Owned For
Owner Type
Purchase Details
Closed on
Feb 19, 1998
Sold by
Johnson Mark F and Johnson Wendy S
Bought by
Kingston John L and Kingston Kimberly S
Current Estimated Value
Home Financials for this Owner
Home Financials are based on the most recent Mortgage that was taken out on this home.
Original Mortgage
$212,500
Outstanding Balance
$37,585
Interest Rate
6.99%
Estimated Equity
$420,785
Purchase Details
Closed on
Dec 29, 1994
Sold by
Windsor Development Corp
Bought by
Johnson Mark R and Johnson Wendy S
Home Financials for this Owner
Home Financials are based on the most recent Mortgage that was taken out on this home.
Original Mortgage
$203,000
Interest Rate
8%
Purchase Details
Closed on
Sep 21, 1994
Sold by
The Hills Of Dundee Joint Venture
Bought by
Windsor Development Corp
Create a Home Valuation Report for This Property
The Home Valuation Report is an in-depth analysis detailing your home's value as well as a comparison with similar homes in the area
Home Values in the Area
Average Home Value in this Area
Purchase History
| Date | Buyer | Sale Price | Title Company |
|---|---|---|---|
| Kingston John L | $250,000 | -- | |
| Johnson Mark R | $229,500 | Chicago Title Insurance Co | |
| Windsor Development Corp | $22,666 | Chicago Title Insurance Co |
Source: Public Records
Mortgage History
| Date | Status | Borrower | Loan Amount |
|---|---|---|---|
| Open | Kingston John L | $212,500 | |
| Previous Owner | Johnson Mark R | $203,000 |
Source: Public Records
Tax History Compared to Growth
Tax History
| Year | Tax Paid | Tax Assessment Tax Assessment Total Assessment is a certain percentage of the fair market value that is determined by local assessors to be the total taxable value of land and additions on the property. | Land | Improvement |
|---|---|---|---|---|
| 2024 | $10,109 | $132,016 | $27,254 | $104,762 |
| 2023 | $9,480 | $118,783 | $24,522 | $94,261 |
| 2022 | $9,281 | $111,347 | $24,522 | $86,825 |
| 2021 | $8,958 | $105,134 | $23,154 | $81,980 |
| 2020 | $8,793 | $102,770 | $22,633 | $80,137 |
| 2019 | $8,511 | $97,561 | $21,486 | $76,075 |
| 2018 | $8,935 | $99,688 | $21,061 | $78,627 |
| 2017 | $8,512 | $93,254 | $19,702 | $73,552 |
| 2016 | $8,506 | $88,622 | $23,811 | $64,811 |
| 2015 | -- | $83,042 | $22,312 | $60,730 |
| 2014 | -- | $80,749 | $21,696 | $59,053 |
| 2013 | -- | $83,221 | $22,360 | $60,861 |
Source: Public Records
Map
Nearby Homes
- Marianne Plan at Hickory Glen
- Charlotte Plan at Hickory Glen
- 1023 Shagbark Ln
- 1031 Shagbark Ln
- 812 Lindsay Ln
- 822 Lindsay Ln
- 814 Lindsay Ln
- 816 Lindsay Ln
- 813 Lindsay Ln
- 825 Lindsay Ln
- 818 Lindsay Ln
- 1601 Higgins Rd
- 1715 W Main St
- 215 Sharon Dr
- 17N448 Il Route 31
- 36W461 Binnie Rd
- 325 Sharon Dr
- 1 S Lincoln Ave
- 104 Thorobred Ln
- 2742 Connolly Ln
- 1119 Thatcher Trail Unit 2
- 1131 Thatcher Trail
- 2135 Hamilton Dr Unit 1
- 1113 Thatcher Trail Unit 2
- 1139 Thatcher Trail Unit 2
- 2123 Hamilton Dr Unit 1
- 2147 Hamilton Dr
- 1122 Thatcher Trail
- 1032 Tristram Ct
- 1136 Thatcher Trail Unit 2
- 1114 Thatcher Trail
- 2117 Hamilton Dr Unit 1
- 2159 Hamilton Dr Unit 1
- 1024 Tristram Ct
- 1105 Thatcher Trail
- 1143 Thatcher Trail Unit 2
- 2167 Hamilton Dr Unit 1
- 1148 Thatcher Trail Unit 2
- 1016 Tristram Ct Unit 2
- 1101 Thatcher Trail