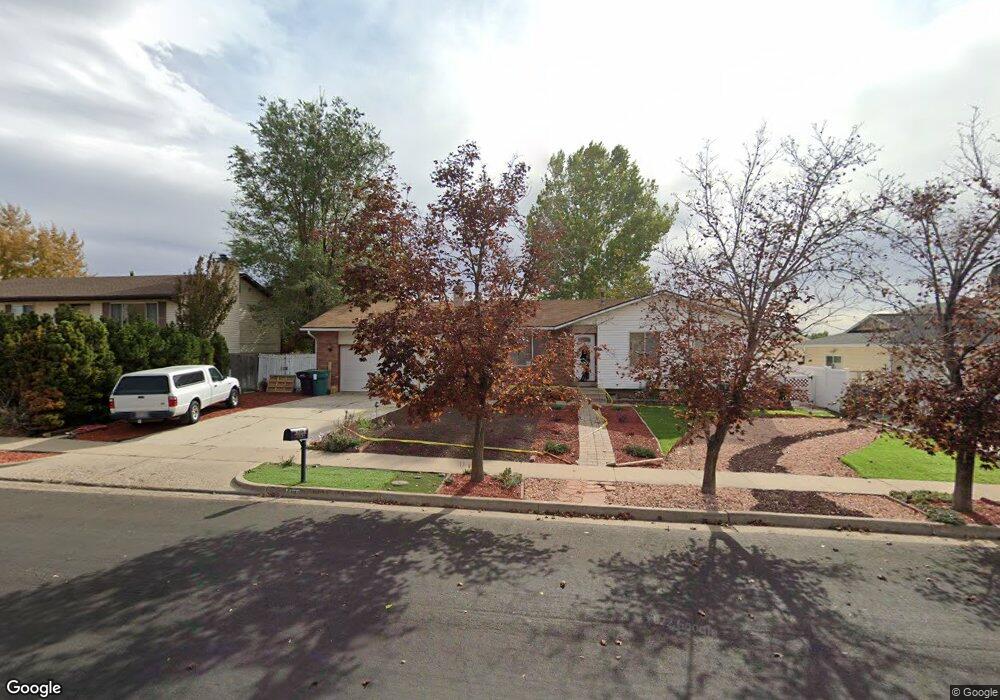
1125 W 725 N Clearfield, UT 84015
Estimated Value: $414,000 - $458,000
4
Beds
1
Bath
2,278
Sq Ft
$189/Sq Ft
Est. Value
About This Home
This home is located at 1125 W 725 N, Clearfield, UT 84015 and is currently estimated at $430,775, approximately $189 per square foot. 1125 W 725 N is a home located in Davis County with nearby schools including Holt Elementary School, North Davis Junior High School, and Syracuse High School.
Ownership History
Date
Name
Owned For
Owner Type
Purchase Details
Closed on
Sep 26, 2002
Sold by
Gowers Brent S and Gowers Ronald B
Bought by
Gowers Brent S
Current Estimated Value
Purchase Details
Closed on
Sep 25, 2002
Sold by
Gowers Brent S
Bought by
Gowers Brent S and Gowers Terrie L
Purchase Details
Closed on
Nov 10, 2000
Sold by
Gowers Brent Stanley and Gowers Ronald B
Bought by
Gowers Brent S and Gowers Ronald B
Home Financials for this Owner
Home Financials are based on the most recent Mortgage that was taken out on this home.
Original Mortgage
$99,335
Outstanding Balance
$35,967
Interest Rate
7.82%
Mortgage Type
FHA
Estimated Equity
$394,808
Purchase Details
Closed on
Jul 16, 1997
Sold by
Jarman Scott and Jarman Susan
Bought by
Gowers Brent Stanley and Gowers Ronald B
Home Financials for this Owner
Home Financials are based on the most recent Mortgage that was taken out on this home.
Original Mortgage
$99,489
Interest Rate
7.83%
Mortgage Type
FHA
Create a Home Valuation Report for This Property
The Home Valuation Report is an in-depth analysis detailing your home's value as well as a comparison with similar homes in the area
Home Values in the Area
Average Home Value in this Area
Purchase History
| Date | Buyer | Sale Price | Title Company |
|---|---|---|---|
| Gowers Brent S | -- | Mountain View Title & Escrow | |
| Gowers Brent S | -- | Mountain View Title & Escrow | |
| Gowers Brent S | -- | Backman Stewart Title Servic | |
| Gowers Brent Stanley | -- | Associated Title Company |
Source: Public Records
Mortgage History
| Date | Status | Borrower | Loan Amount |
|---|---|---|---|
| Open | Gowers Brent S | $99,335 | |
| Closed | Gowers Brent Stanley | $99,489 |
Source: Public Records
Tax History Compared to Growth
Tax History
| Year | Tax Paid | Tax Assessment Tax Assessment Total Assessment is a certain percentage of the fair market value that is determined by local assessors to be the total taxable value of land and additions on the property. | Land | Improvement |
|---|---|---|---|---|
| 2025 | $2,455 | $220,000 | $73,665 | $146,335 |
| 2024 | $2,364 | $213,400 | $70,417 | $142,983 |
| 2023 | $2,197 | $364,000 | $112,552 | $251,448 |
| 2022 | $2,308 | $206,800 | $64,333 | $142,467 |
| 2021 | $2,009 | $272,000 | $69,058 | $202,942 |
| 2020 | $1,748 | $235,000 | $58,200 | $176,800 |
| 2019 | $1,703 | $226,000 | $60,541 | $165,459 |
| 2018 | $1,523 | $197,000 | $53,736 | $143,264 |
| 2016 | $1,200 | $81,125 | $21,509 | $59,616 |
| 2015 | $1,159 | $74,690 | $21,509 | $53,181 |
| 2014 | $1,235 | $80,671 | $21,509 | $59,162 |
| 2013 | -- | $66,663 | $32,175 | $34,488 |
Source: Public Records
Map
Nearby Homes
- 1038 W 800 N
- 844 N 1000 W
- 984 N 1100 W
- 1337 W 550 N Unit 195
- 563 N 1350 W Unit 139
- 1350 W 300 N Unit 49
- 1350 W 300 N Unit 38
- 1350 W 300 N Unit 29
- 690 Barlow St
- 423 N 1250 W Unit 118
- 417 N 1200 W Unit 84
- 1239 W 400 N Unit 63
- 575 N 1350 W Unit 137
- 1251 W 400 N Unit 67
- 1242 W 1075 N
- 303 N Canterbury Way
- 721 N 800 W
- 1121 N 900 W
- 1654 W 600 N
- 626 W 800 N