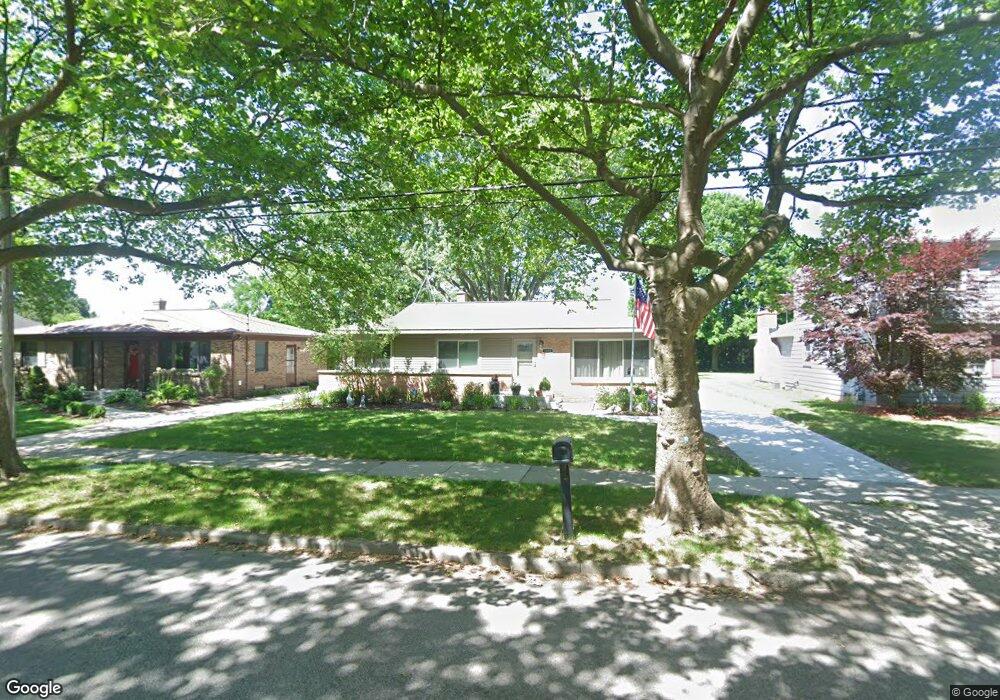
1125 Worcester Dr NE Grand Rapids, MI 49505
North East Citizens Action NeighborhoodEstimated Value: $299,838 - $375,000
3
Beds
2
Baths
1
Sq Ft
$354,460/Sq Ft
Est. Value
About This Home
This home is located at 1125 Worcester Dr NE, Grand Rapids, MI 49505 and is currently estimated at $354,460, approximately $354,460 per square foot. 1125 Worcester Dr NE is a home located in Kent County with nearby schools including Kent Hills School, Riverside Middle School, and Union High School.
Ownership History
Date
Name
Owned For
Owner Type
Purchase Details
Closed on
Nov 18, 2016
Sold by
Pierman Randy S and Pierman Mary
Bought by
Pierman Radny S and Pierman Mary
Current Estimated Value
Home Financials for this Owner
Home Financials are based on the most recent Mortgage that was taken out on this home.
Original Mortgage
$82,000
Outstanding Balance
$38,921
Interest Rate
3.47%
Mortgage Type
New Conventional
Estimated Equity
$315,539
Purchase Details
Closed on
Jul 31, 2013
Sold by
Pierman Randy S and The Estate Of Vicky L Pierman
Bought by
Pierman Randy S
Home Financials for this Owner
Home Financials are based on the most recent Mortgage that was taken out on this home.
Original Mortgage
$84,950
Interest Rate
3.93%
Mortgage Type
New Conventional
Purchase Details
Closed on
Apr 30, 1993
Sold by
Goss James R Maria Lee
Bought by
Pierman Randy S Portwood Vicky and Pierman Randy S
Purchase Details
Closed on
May 7, 1991
Sold by
Loughrin Loughrin J J and Loughrin Goss J
Bought by
Pierman Randy S
Purchase Details
Closed on
Aug 7, 1987
Bought by
Pierman Randy S
Create a Home Valuation Report for This Property
The Home Valuation Report is an in-depth analysis detailing your home's value as well as a comparison with similar homes in the area
Home Values in the Area
Average Home Value in this Area
Purchase History
| Date | Buyer | Sale Price | Title Company |
|---|---|---|---|
| Pierman Radny S | -- | None Available | |
| Pierman Randy S | -- | Title Source Inc | |
| Pierman Randy S Portwood Vicky | $83,500 | -- | |
| Pierman Randy S | $76,500 | -- | |
| Pierman Randy S | $67,900 | -- |
Source: Public Records
Mortgage History
| Date | Status | Borrower | Loan Amount |
|---|---|---|---|
| Open | Pierman Radny S | $82,000 | |
| Closed | Pierman Randy S | $84,950 |
Source: Public Records
Tax History Compared to Growth
Tax History
| Year | Tax Paid | Tax Assessment Tax Assessment Total Assessment is a certain percentage of the fair market value that is determined by local assessors to be the total taxable value of land and additions on the property. | Land | Improvement |
|---|---|---|---|---|
| 2025 | $2,501 | $126,000 | $0 | $0 |
| 2024 | $2,501 | $122,500 | $0 | $0 |
| 2023 | $2,538 | $111,700 | $0 | $0 |
| 2022 | $2,409 | $98,700 | $0 | $0 |
| 2021 | $2,356 | $93,200 | $0 | $0 |
| 2020 | $2,282 | $86,400 | $0 | $0 |
| 2019 | $2,389 | $79,800 | $0 | $0 |
| 2018 | $2,308 | $76,500 | $0 | $0 |
| 2017 | $2,247 | $67,200 | $0 | $0 |
| 2016 | $2,244 | $64,800 | $0 | $0 |
| 2015 | $2,087 | $64,800 | $0 | $0 |
| 2013 | -- | $59,600 | $0 | $0 |
Source: Public Records
Map
Nearby Homes
- 1283 Cranbrook Terrace NE Unit 18
- 1307 Cranbrook Terrace NE
- 2309 Watertown Way
- 2319 Watertown Way
- 2223 Watertown Way
- 2225 Watertown Way
- 2243 Watertown Way
- 2229 Watertown Way
- 2275 Watertown Way
- 2200 S Eventide Dr NE
- 2268 Watertown Way
- 2351 Watertown Way Unit 6
- 2384 Watertown Way Unit 44
- 2330 Watertown Way
- 1410 Rothbury Dr NE
- 1320 Beckwith Ave NE
- 1455 Tenby Ct NE
- 1659 Mason St NE
- 1240 Edith Ave NE
- 1435 Matilda St NE
- 1131 Worcester Dr NE
- 1119 Worcester Dr NE
- 1137 Worcester Dr NE
- 1111 Worcester Dr NE
- 1143 Worcester Dr NE
- 1124 Worcester Dr NE
- 1130 Worcester Dr NE
- 1118 Worcester Dr NE
- 1136 Worcester Dr NE
- 1149 Worcester Dr NE
- 1101 Worcester Dr NE
- 1112 Worcester Dr NE
- 1108 Worcester Dr NE
- 1061 Worcester Dr NE
- 1155 Worcester Dr NE
- 2186 Leonard St NE
- 1100 Worcester Dr NE
- 1125 Walwood Dr NE
- 1055 Worcester Dr NE
- 1121 Walwood Dr NE