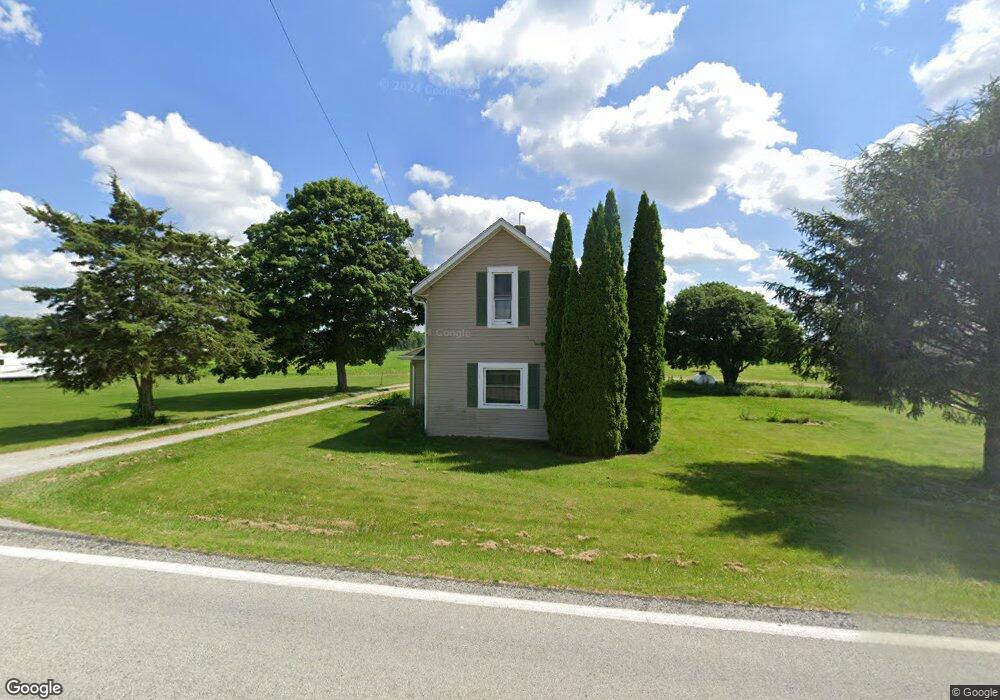
11253 W State Route 29 Conover, OH 45317
Estimated Value: $170,000 - $254,000
2
Beds
1
Bath
1,085
Sq Ft
$191/Sq Ft
Est. Value
About This Home
This home is located at 11253 W State Route 29, Conover, OH 45317 and is currently estimated at $207,258, approximately $191 per square foot. 11253 W State Route 29 is a home located in Champaign County with nearby schools including Graham Elementary School, Graham Middle School, and Graham High School.
Ownership History
Date
Name
Owned For
Owner Type
Purchase Details
Closed on
Mar 13, 2015
Sold by
Fannie Mae
Bought by
Armstrong David M
Current Estimated Value
Home Financials for this Owner
Home Financials are based on the most recent Mortgage that was taken out on this home.
Original Mortgage
$79,125
Outstanding Balance
$60,332
Interest Rate
3.56%
Mortgage Type
VA
Estimated Equity
$146,926
Purchase Details
Closed on
Aug 25, 2014
Sold by
Johnson Shawn and The Citizens Banking Co
Bought by
Federal National Mortgage Association
Purchase Details
Closed on
Oct 14, 2011
Sold by
Nigh Jerry D and Nigh Lora L
Bought by
Johnson Shawn
Home Financials for this Owner
Home Financials are based on the most recent Mortgage that was taken out on this home.
Original Mortgage
$71,200
Interest Rate
4.22%
Mortgage Type
FHA
Create a Home Valuation Report for This Property
The Home Valuation Report is an in-depth analysis detailing your home's value as well as a comparison with similar homes in the area
Home Values in the Area
Average Home Value in this Area
Purchase History
| Date | Buyer | Sale Price | Title Company |
|---|---|---|---|
| Armstrong David M | -- | Omega Title Agency Llc | |
| Federal National Mortgage Association | $56,667 | None Available | |
| Johnson Shawn | $89,000 | None Available |
Source: Public Records
Mortgage History
| Date | Status | Borrower | Loan Amount |
|---|---|---|---|
| Open | Armstrong David M | $79,125 | |
| Previous Owner | Johnson Shawn | $71,200 |
Source: Public Records
Tax History Compared to Growth
Tax History
| Year | Tax Paid | Tax Assessment Tax Assessment Total Assessment is a certain percentage of the fair market value that is determined by local assessors to be the total taxable value of land and additions on the property. | Land | Improvement |
|---|---|---|---|---|
| 2024 | $1,746 | $46,380 | $8,180 | $38,200 |
| 2023 | $1,746 | $46,380 | $8,180 | $38,200 |
| 2022 | $1,818 | $46,380 | $8,180 | $38,200 |
| 2021 | $1,599 | $38,370 | $6,540 | $31,830 |
| 2020 | $1,548 | $38,370 | $6,540 | $31,830 |
| 2019 | $1,579 | $38,370 | $6,540 | $31,830 |
| 2018 | $1,300 | $31,350 | $6,540 | $24,810 |
| 2017 | $1,126 | $31,350 | $6,540 | $24,810 |
| 2016 | $1,117 | $31,350 | $6,540 | $24,810 |
| 2015 | $1,149 | $30,700 | $6,920 | $23,780 |
| 2014 | $1,161 | $30,700 | $6,920 | $23,780 |
| 2013 | $1,181 | $30,700 | $6,920 | $23,780 |
Source: Public Records
Map
Nearby Homes
- 13147 Shanley Rd
- 8475 State Route 29
- 8676 Sidney St
- 7650 Calland Rd
- 5641 Calland Rd
- 207 South St
- 1262 N Heck Hill Rd
- 101 Maple Dr
- 371 W Lynn St
- 115 S High St
- 203 W Main St
- 148 Dorsey Hageman Rd
- 126 Bowersock Ave
- 632 S Main St
- 572 S Main St
- 218 W Troy St
- 380 S Main St
- 211 Dugan St
- 133 Dugan St
- 117 N Boggs St
- 11330 W State Route 29
- 11389 W State Route 29
- 11411 W State Route 29
- 11141 W State Route 29
- 11141 Ohio 29
- 11105 Ohio 29
- 11106 Archer St
- 11105 Archer St
- 11094 Archer St
- 11095 Archer St
- 11083 W State Route 29
- 11074 Archer St
- 11075 W State Route 29
- 11064 Archer St
- 11053 Archer St
- 11064 Bodey St
- 11025 W State Route 29
- 11019 Ohio 29
- 6484 Kiser Lake Rd
- 11514 W State Route 29