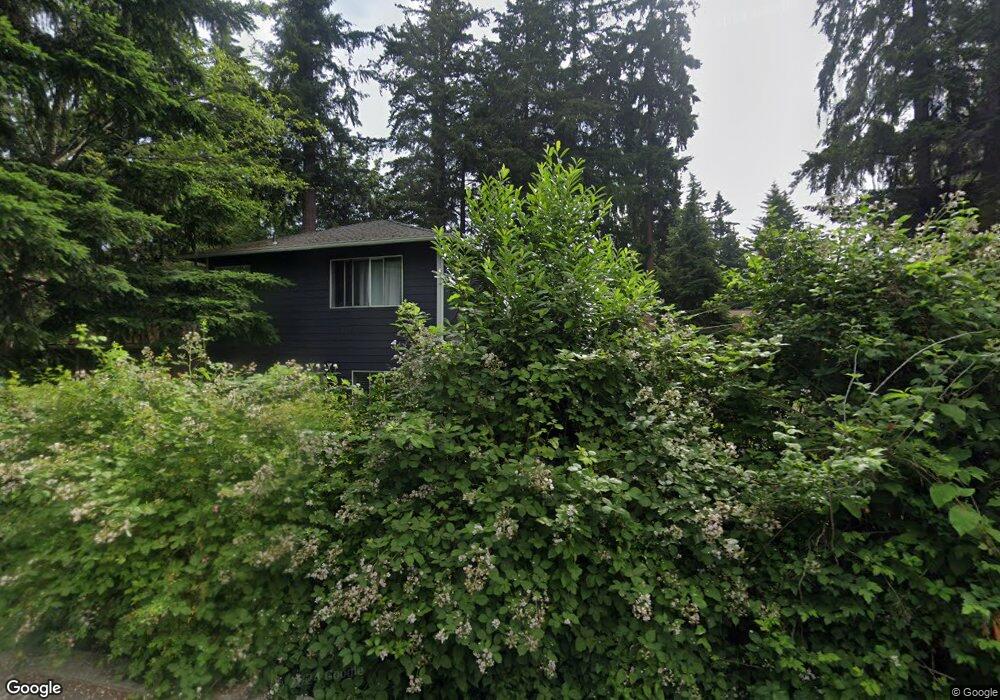
11254 NE 112th St Kirkland, WA 98033
South Juanita NeighborhoodEstimated Value: $1,557,000 - $1,748,532
4
Beds
3
Baths
1,950
Sq Ft
$827/Sq Ft
Est. Value
About This Home
This home is located at 11254 NE 112th St, Kirkland, WA 98033 and is currently estimated at $1,612,883, approximately $827 per square foot. 11254 NE 112th St is a home located in King County with nearby schools including Alexander Graham Bell Elementary School, Finn Hill Middle School, and Juanita High School.
Ownership History
Date
Name
Owned For
Owner Type
Purchase Details
Closed on
Sep 3, 1998
Sold by
Main Cindy J
Bought by
Reynolds Michael W
Current Estimated Value
Home Financials for this Owner
Home Financials are based on the most recent Mortgage that was taken out on this home.
Original Mortgage
$227,150
Outstanding Balance
$48,606
Interest Rate
6.92%
Estimated Equity
$1,564,277
Purchase Details
Closed on
Jun 23, 1997
Sold by
Wong Curtis K T and Wong Ruthanne M
Bought by
Reynolds Michael W
Home Financials for this Owner
Home Financials are based on the most recent Mortgage that was taken out on this home.
Original Mortgage
$266,000
Interest Rate
7.91%
Purchase Details
Closed on
Nov 14, 1994
Sold by
Corn Randy D
Bought by
Wong Curtis K T and Wong Ruthanne M
Home Financials for this Owner
Home Financials are based on the most recent Mortgage that was taken out on this home.
Original Mortgage
$216,600
Interest Rate
6.5%
Purchase Details
Closed on
Dec 17, 1992
Sold by
Obaitek Ramona J
Bought by
Corn Randy D
Create a Home Valuation Report for This Property
The Home Valuation Report is an in-depth analysis detailing your home's value as well as a comparison with similar homes in the area
Home Values in the Area
Average Home Value in this Area
Purchase History
| Date | Buyer | Sale Price | Title Company |
|---|---|---|---|
| Reynolds Michael W | -- | Chicago Title Insurance Co | |
| Reynolds Michael W | $280,000 | Transnation Title Insurance | |
| Wong Curtis K T | $228,000 | Stewart Title | |
| Corn Randy D | $56,000 | -- |
Source: Public Records
Mortgage History
| Date | Status | Borrower | Loan Amount |
|---|---|---|---|
| Open | Reynolds Michael W | $227,150 | |
| Previous Owner | Reynolds Michael W | $266,000 | |
| Previous Owner | Wong Curtis K T | $216,600 | |
| Closed | Reynolds Michael W | $43,600 |
Source: Public Records
Tax History Compared to Growth
Tax History
| Year | Tax Paid | Tax Assessment Tax Assessment Total Assessment is a certain percentage of the fair market value that is determined by local assessors to be the total taxable value of land and additions on the property. | Land | Improvement |
|---|---|---|---|---|
| 2024 | $12,639 | $1,554,000 | $939,000 | $615,000 |
| 2023 | $12,202 | $1,423,000 | $860,000 | $563,000 |
| 2022 | $10,747 | $1,716,000 | $1,039,000 | $677,000 |
| 2021 | $9,533 | $1,204,000 | $733,000 | $471,000 |
| 2020 | $9,416 | $980,000 | $630,000 | $350,000 |
| 2018 | $8,377 | $958,000 | $617,000 | $341,000 |
| 2017 | $7,072 | $821,000 | $554,000 | $267,000 |
| 2016 | $6,807 | $721,000 | $493,000 | $228,000 |
| 2015 | $6,132 | $685,000 | $462,000 | $223,000 |
| 2014 | -- | $593,000 | $446,000 | $147,000 |
| 2013 | -- | $488,000 | $406,000 | $82,000 |
Source: Public Records
Map
Nearby Homes
- 11315 113th Place NE
- 11222 115th Place NE
- 11218 115th Place NE
- 11109 116th Ave NE
- 11526 114th Ct NE Unit 2A
- 11527 113th Place NE
- 11512 NE 115th Ct
- 11019 NE 116th St
- 11215 NE 116th Place
- 11521 117th Ln NE Unit 2
- 10819 (HS 99) 120th Ln NE Unit A
- 10819 (HS 101) 120th Ln NE Unit C
- 10827 NE 108th St
- 10815 (HS 104) 120th Ln NE Unit E
- 10823 (HS 94) 120th Ln NE Unit E
- 10824 (HS 79) 120th Ln NE Unit B
- Kinney Plan at Cross Kirkland Towns
- Maryhill Plan at Cross Kirkland Towns
- 11120 NE 106th Place
- 10828 (HS 83) 120th Ln NE Unit C
- 11258 NE 112th St
- 11300 NE 112th St
- 11402 NE 112th St
- 11238 NE 112th St
- 11252 NE 112th St
- 11230 NE 112th St
- 11215 114th Place NE
- 11410 NE 112th St
- 11242 NE 112th St
- 11250 NE 112th St
- 11219 114th Place NE
- 11223 114th Place NE
- 11391 NE 112th St
- 11351 NE 112th St
- 11395 NE 112th St
- 11347 NE 112th St
- 11227 114th Place NE
- 11405 NE 112th St
- 11223 NE 112th St