11257 Irvin Rd Creston, OH 44217
Estimated Value: $327,000 - $627,000
3
Beds
2
Baths
1,948
Sq Ft
$227/Sq Ft
Est. Value
About This Home
This home is located at 11257 Irvin Rd, Creston, OH 44217 and is currently estimated at $442,548, approximately $227 per square foot. 11257 Irvin Rd is a home located in Wayne County with nearby schools including Norwayne Elementary School, Norwayne Middle School, and Norwayne High School.
Ownership History
Date
Name
Owned For
Owner Type
Purchase Details
Closed on
Oct 27, 2006
Sold by
Ogden Kay F
Bought by
Ogden John W
Current Estimated Value
Purchase Details
Closed on
Sep 23, 1999
Sold by
Theiss Jay S
Bought by
Ogden John W and Ogden Kay F
Home Financials for this Owner
Home Financials are based on the most recent Mortgage that was taken out on this home.
Original Mortgage
$128,250
Outstanding Balance
$39,161
Interest Rate
8.21%
Mortgage Type
New Conventional
Estimated Equity
$403,387
Purchase Details
Closed on
Oct 1, 1991
Sold by
Ault Timothy W and Ault Katrina
Bought by
Theiss Jay Samuel & Paula
Purchase Details
Closed on
May 23, 1988
Sold by
Nussbaum Daniel A and Nussbaum Denis
Bought by
Ault Timothy W and Ault Katrina
Create a Home Valuation Report for This Property
The Home Valuation Report is an in-depth analysis detailing your home's value as well as a comparison with similar homes in the area
Home Values in the Area
Average Home Value in this Area
Purchase History
| Date | Buyer | Sale Price | Title Company |
|---|---|---|---|
| Ogden John W | -- | None Available | |
| Ogden John W | $135,000 | -- | |
| Theiss Jay Samuel & Paula | $92,000 | -- | |
| Ault Timothy W | -- | -- |
Source: Public Records
Mortgage History
| Date | Status | Borrower | Loan Amount |
|---|---|---|---|
| Open | Ogden John W | $128,250 |
Source: Public Records
Tax History Compared to Growth
Tax History
| Year | Tax Paid | Tax Assessment Tax Assessment Total Assessment is a certain percentage of the fair market value that is determined by local assessors to be the total taxable value of land and additions on the property. | Land | Improvement |
|---|---|---|---|---|
| 2024 | $3,506 | $93,570 | $30,170 | $63,400 |
| 2023 | $3,506 | $97,180 | $30,170 | $67,010 |
| 2022 | $2,926 | $70,930 | $22,020 | $48,910 |
| 2021 | $2,961 | $70,930 | $22,020 | $48,910 |
| 2020 | $2,980 | $70,930 | $22,020 | $48,910 |
| 2019 | $2,280 | $56,020 | $16,640 | $39,380 |
| 2018 | $2,292 | $56,020 | $16,640 | $39,380 |
| 2017 | $2,215 | $56,020 | $16,640 | $39,380 |
| 2016 | $2,185 | $53,860 | $16,000 | $37,860 |
| 2015 | $2,157 | $53,860 | $16,000 | $37,860 |
| 2014 | $2,177 | $53,860 | $16,000 | $37,860 |
| 2013 | $2,105 | $48,920 | $18,320 | $30,600 |
Source: Public Records
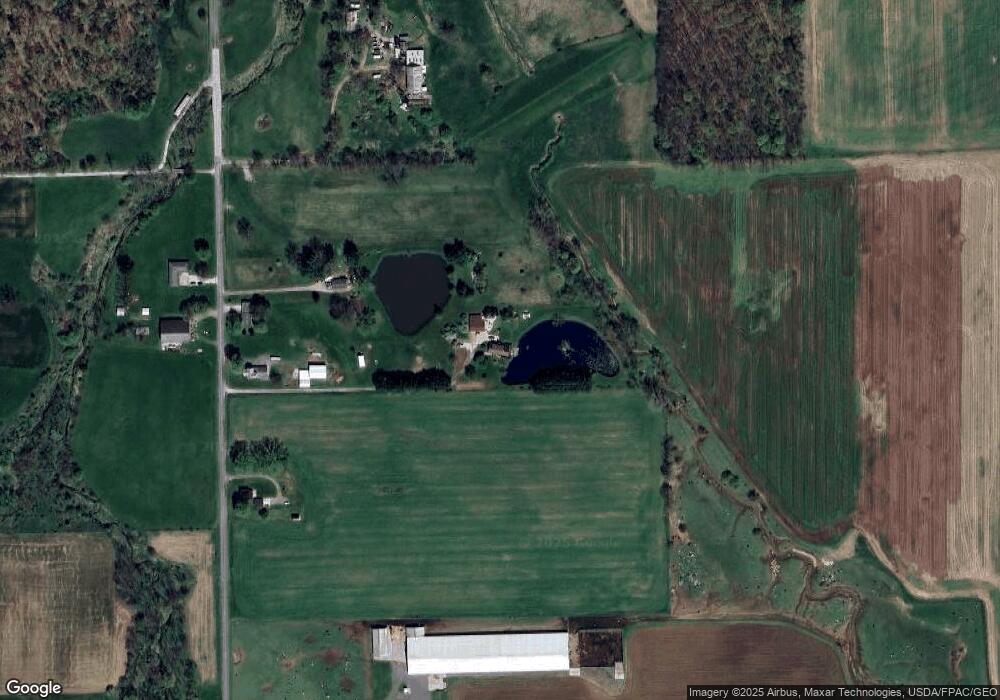
Map
Nearby Homes
- 12567 Eby Rd
- 6471 Easton Rd
- 11387 Canaan Center Rd
- 11835 Canaan Center Rd
- 13506 Kauffman Ave
- 13731 Kauffman Ave
- 154 Garden St
- 124 Garden St
- 14599 Eby Rd
- 153 S Main St
- 00 Sterling St
- 147 N Main St
- 0 Burbank St
- 128 Burbank St
- 10368 Wooster Pike
- 1457 Fox Lake Rd
- 137 Forest View Ct
- 7190 N Geyers Chapel Rd
- 747 Britton Rd
- 2710 E Hutton Rd
- 11319 Irvin Rd
- 11267 Irvin Rd
- 11301 Irvin Rd
- 11187 Irvin Rd
- 11025 Irvin Rd
- 11407 Irvin Rd
- 11330 Irvin Rd
- 11000 Irvin Rd
- 4580 Steiner Rd
- 10824 Irvin Rd
- 4319 Steiner Rd
- 10779 Irvin Rd
- 4682 Steiner Rd
- 4507 Steiner Rd
- 10774 Irvin Rd
- 10741 Irvin Rd
- 10687 Irvin Rd
- 10687 Irvin Rd
- 4047 Steiner Rd
- 10676 Irvin Rd