Estimated Value: $275,942 - $373,000
4
Beds
2
Baths
996
Sq Ft
$312/Sq Ft
Est. Value
About This Home
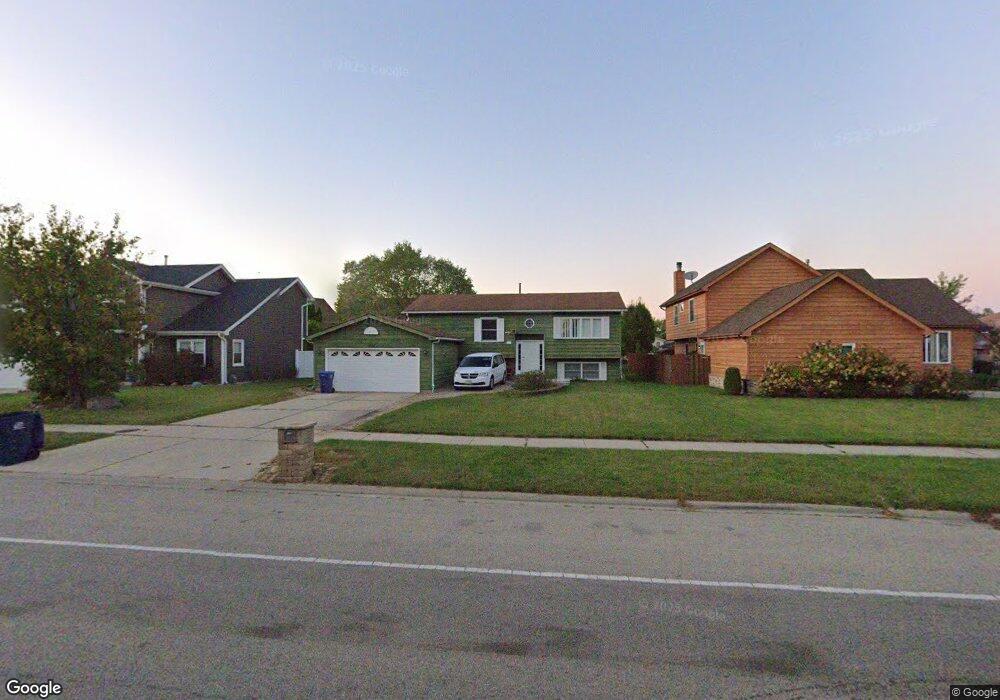
This home is located at 1126 Beach Rd, Zion, IL 60099 and is currently estimated at $310,986, approximately $312 per square foot. 1126 Beach Rd is a home located in Lake County with nearby schools including Oak Crest School, Beach Park Middle School, and Zion-Benton Township High School.
Ownership History
Date
Name
Owned For
Owner Type
Purchase Details
Closed on
Dec 15, 2025
Sold by
Csma Ft Llc
Bought by
Fkh Sfr R Lp
Current Estimated Value
Purchase Details
Closed on
Apr 28, 2015
Sold by
Five Ten Illinois Iii Llc
Bought by
Csma Ft Llc
Purchase Details
Closed on
Jun 25, 2013
Sold by
Parada Cirilo
Bought by
Five Ten Llinois Llc
Purchase Details
Closed on
Apr 3, 2003
Sold by
Prudential Relocation Inc
Bought by
Parada Cirilo and Manjarrez Sergio
Home Financials for this Owner
Home Financials are based on the most recent Mortgage that was taken out on this home.
Original Mortgage
$170,327
Interest Rate
5.36%
Mortgage Type
FHA
Purchase Details
Closed on
Apr 2, 2003
Sold by
Jones Ralph and Jones Gloria A
Bought by
Prudential Relocation Inc
Home Financials for this Owner
Home Financials are based on the most recent Mortgage that was taken out on this home.
Original Mortgage
$170,327
Interest Rate
5.36%
Mortgage Type
FHA
Create a Home Valuation Report for This Property
The Home Valuation Report is an in-depth analysis detailing your home's value as well as a comparison with similar homes in the area
Purchase History
| Date | Buyer | Sale Price | Title Company |
|---|---|---|---|
| Fkh Sfr R Lp | -- | Mainstay National Title Llc | |
| Csma Ft Llc | $170,000 | Avenue 365 Lender Services | |
| Five Ten Llinois Llc | $67,500 | Greater Illinois Title Compa | |
| Parada Cirilo | $173,000 | First American Title | |
| Prudential Relocation Inc | -- | First American Title Insuran |
Source: Public Records
Mortgage History
| Date | Status | Borrower | Loan Amount |
|---|---|---|---|
| Previous Owner | Parada Cirilo | $170,327 |
Source: Public Records
Tax History
| Year | Tax Paid | Tax Assessment Tax Assessment Total Assessment is a certain percentage of the fair market value that is determined by local assessors to be the total taxable value of land and additions on the property. | Land | Improvement |
|---|---|---|---|---|
| 2024 | $8,937 | $77,917 | $5,898 | $72,019 |
| 2023 | $7,497 | $71,282 | $5,694 | $65,588 |
| 2022 | $7,497 | $58,568 | $5,562 | $53,006 |
| 2021 | $7,753 | $57,079 | $5,421 | $51,658 |
| 2020 | $7,647 | $54,470 | $5,173 | $49,297 |
| 2019 | $7,660 | $51,679 | $4,908 | $46,771 |
| 2018 | $7,301 | $47,448 | $5,850 | $41,598 |
| 2017 | $7,296 | $44,636 | $5,503 | $39,133 |
| 2016 | $7,113 | $42,494 | $5,239 | $37,255 |
| 2015 | $6,974 | $38,971 | $4,805 | $34,166 |
| 2014 | $6,082 | $41,536 | $12,495 | $29,041 |
| 2012 | $7,365 | $50,767 | $12,984 | $37,783 |
Source: Public Records
Map
Nearby Homes
- 3805 Bertrand Ln
- 38633 N Cedar Ave
- 1136 10 Pin Ln
- 38546 N Pine Ave
- 1403 W Beach Rd
- 38410 N Tewes Ct
- 38169 N North Shore Ave
- 38132 N Manor Ave
- 38119 N Wilson Ave
- 1730 W Beach Rd
- 10435 W Chaplin Ave
- 11471 W Leland Ave
- 11342-11364 W Wadsworth Rd
- 10606 W Eastwood Rd
- 10895 W 34th St
- 10093 W Ford Ave
- 39266 N North Ave
- 39294 N North Ave
- 10038 W Beach Rd
- 3249 Gilead Ave
- 1130 Beach Rd
- 1122 Beach Rd
- 1129 Tewes Ln
- 1125 Tewes Ln
- 1118 Beach Rd
- 1121 Tewes Ln
- 1133 Tewes Ln
- 38484 N North Shore Ave
- 1117 Tewes Ln
- 1114 Beach Rd
- 1138 Beach Rd
- 1138 Beach Rd
- 1137 Tewes Ln
- 10999 W Beach Rd
- 1111 Beach Rd
- 10949 W Beach Rd
- 3800 Bertrand Ln
- 1141 Tewes Ln
- 1111 Tewes Ln
- 38468 N North Shore Ave
Your Personal Tour Guide
Ask me questions while you tour the home.