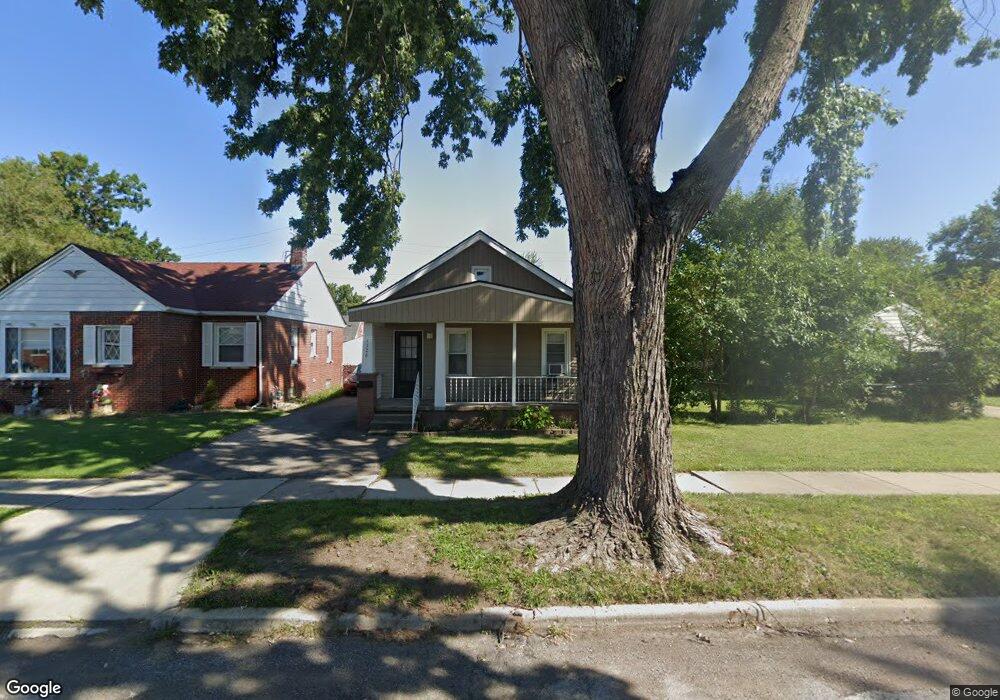
1126 Cleveland Ave Lincoln Park, MI 48146
Estimated Value: $134,000 - $160,000
--
Bed
--
Bath
814
Sq Ft
$184/Sq Ft
Est. Value
About This Home
This home is located at 1126 Cleveland Ave, Lincoln Park, MI 48146 and is currently estimated at $150,072, approximately $184 per square foot. 1126 Cleveland Ave is a home located in Wayne County with nearby schools including Keppen School, Lincoln Park Middle School, and Lincoln Park High School.
Ownership History
Date
Name
Owned For
Owner Type
Purchase Details
Closed on
Sep 6, 2019
Sold by
Equityb Trust Company
Bought by
Sloan Michael K
Current Estimated Value
Home Financials for this Owner
Home Financials are based on the most recent Mortgage that was taken out on this home.
Original Mortgage
$48,500
Outstanding Balance
$42,482
Interest Rate
3.6%
Mortgage Type
New Conventional
Estimated Equity
$107,590
Purchase Details
Closed on
Jan 7, 2011
Sold by
Fribush Paul J and Magier Judith
Bought by
Equity Trust Company and Rosemary A Bates Ira Account #34402
Purchase Details
Closed on
Oct 27, 2008
Sold by
Domus Investments Unlimited Llc
Bought by
Fribush Paul J
Purchase Details
Closed on
Jan 11, 2008
Sold by
Woolery Louis E and Woolery Susan A
Bought by
Domus Investments Unlimited Llc
Purchase Details
Closed on
May 3, 2000
Sold by
Nina N Sionkowski
Bought by
Nina N Sionkowski
Purchase Details
Closed on
Apr 7, 2000
Sold by
Woolery Helen G
Bought by
Sionkowski Nina N
Create a Home Valuation Report for This Property
The Home Valuation Report is an in-depth analysis detailing your home's value as well as a comparison with similar homes in the area
Home Values in the Area
Average Home Value in this Area
Purchase History
| Date | Buyer | Sale Price | Title Company |
|---|---|---|---|
| Sloan Michael K | $50,000 | Michigan Title Ins Agcy Inc | |
| Equity Trust Company | $17,500 | Michigan Title Insurance Age | |
| Fribush Paul J | $500 | None Available | |
| Domus Investments Unlimited Llc | $27,000 | Multiple | |
| Nina N Sionkowski | -- | -- | |
| Sionkowski Nina N | -- | -- |
Source: Public Records
Mortgage History
| Date | Status | Borrower | Loan Amount |
|---|---|---|---|
| Open | Sloan Michael K | $48,500 |
Source: Public Records
Tax History Compared to Growth
Tax History
| Year | Tax Paid | Tax Assessment Tax Assessment Total Assessment is a certain percentage of the fair market value that is determined by local assessors to be the total taxable value of land and additions on the property. | Land | Improvement |
|---|---|---|---|---|
| 2025 | $2,364 | $74,300 | $0 | $0 |
| 2024 | $2,364 | $63,400 | $0 | $0 |
| 2023 | $2,539 | $57,700 | $0 | $0 |
| 2022 | $2,497 | $48,400 | $0 | $0 |
| 2021 | $2,438 | $45,900 | $0 | $0 |
| 2020 | $2,414 | $33,200 | $0 | $0 |
| 2019 | $1,647 | $30,300 | $0 | $0 |
| 2018 | $1,383 | $25,100 | $0 | $0 |
| 2017 | $710 | $23,200 | $0 | $0 |
| 2016 | $1,656 | $23,200 | $0 | $0 |
| 2015 | $2,280 | $22,800 | $0 | $0 |
| 2013 | $2,350 | $24,500 | $0 | $0 |
| 2012 | $1,974 | $25,300 | $7,300 | $18,000 |
Source: Public Records
Map
Nearby Homes
- 1125 Mill St
- 1115 Mill St
- 1194 Lincoln Ave
- 1208 Mill St
- 1215 Mill St
- 1184 Farnham Ave
- 2419 Chandler Ave
- 1042 Champaign Rd
- 1187 Park Ave
- 1027 Park Ave
- 1151 Progress Ave
- 1370 Garfield Ave
- 5114 Hawthorn
- 881 Garfield Ave
- 878 Champaign Rd
- 880 White Ave
- 853 Mill St
- 817 Lincoln Ave
- 1673 Ferris Ave
- 1051 Capitol Ave
- 1130 Cleveland Ave
- 1116 Cleveland Ave
- 1154 Cleveland Ave
- 1112 Cleveland Ave
- 1123 Lincoln Ave
- 1127 Lincoln Ave
- 1117 Lincoln Ave
- 1133 Lincoln Ave
- 1108 Cleveland Ave
- 1111 Lincoln Ave
- 1125 Cleveland Ave
- 1153 Lincoln Ave
- 1133 Cleveland Ave
- 1119 Cleveland Ave
- 1164 Cleveland Ave
- 1115 Cleveland Ave
- 1153 Cleveland Ave
- 1107 Lincoln Ave
- 1157 Lincoln Ave
- 1168 Cleveland Ave