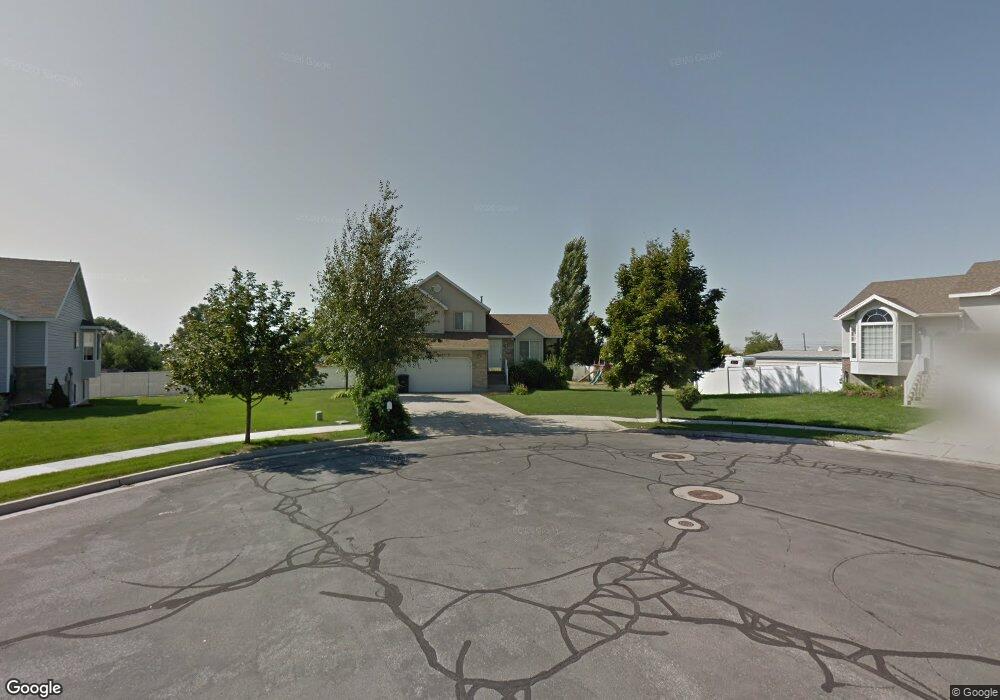
1126 E 1350 S Clearfield, UT 84015
Estimated Value: $434,000 - $539,000
3
Beds
2
Baths
1,832
Sq Ft
$261/Sq Ft
Est. Value
About This Home
This home is located at 1126 E 1350 S, Clearfield, UT 84015 and is currently estimated at $478,141, approximately $260 per square foot. 1126 E 1350 S is a home located in Davis County with nearby schools including South Clearfield Elementary School, North Davis Junior High School, and Clearfield High School.
Ownership History
Date
Name
Owned For
Owner Type
Purchase Details
Closed on
May 24, 2018
Bought by
Wininger Kyle
Current Estimated Value
Home Financials for this Owner
Home Financials are based on the most recent Mortgage that was taken out on this home.
Original Mortgage
$242,500
Outstanding Balance
$210,036
Interest Rate
4.66%
Estimated Equity
$268,105
Purchase Details
Closed on
Mar 29, 2005
Sold by
Gwynn Joshua E and Gwynn Jennifer A
Bought by
Greenwood Christopher R and Greenwood Tami
Home Financials for this Owner
Home Financials are based on the most recent Mortgage that was taken out on this home.
Original Mortgage
$164,500
Interest Rate
9.87%
Mortgage Type
Adjustable Rate Mortgage/ARM
Purchase Details
Closed on
Feb 6, 2001
Sold by
Gmw Development Inc
Bought by
Gwynn Joshua B and Gwynn Jennifer A
Home Financials for this Owner
Home Financials are based on the most recent Mortgage that was taken out on this home.
Original Mortgage
$148,667
Interest Rate
7.08%
Mortgage Type
FHA
Create a Home Valuation Report for This Property
The Home Valuation Report is an in-depth analysis detailing your home's value as well as a comparison with similar homes in the area
Home Values in the Area
Average Home Value in this Area
Purchase History
| Date | Buyer | Sale Price | Title Company |
|---|---|---|---|
| Wininger Kyle | -- | -- | |
| Greenwood Christopher R | -- | First American Title | |
| Gwynn Joshua B | -- | Bonneville Title Company Inc |
Source: Public Records
Mortgage History
| Date | Status | Borrower | Loan Amount |
|---|---|---|---|
| Open | Wininger Kyle | $242,500 | |
| Closed | Wininger Kyle | -- | |
| Previous Owner | Greenwood Christopher R | $164,500 | |
| Previous Owner | Gwynn Joshua B | $148,667 |
Source: Public Records
Tax History
| Year | Tax Paid | Tax Assessment Tax Assessment Total Assessment is a certain percentage of the fair market value that is determined by local assessors to be the total taxable value of land and additions on the property. | Land | Improvement |
|---|---|---|---|---|
| 2025 | $2,529 | $226,600 | $88,990 | $137,610 |
| 2024 | $2,462 | $222,200 | $84,977 | $137,223 |
| 2023 | $2,221 | $368,000 | $134,589 | $233,411 |
| 2022 | $2,394 | $214,500 | $72,253 | $142,247 |
| 2021 | $1,906 | $258,000 | $83,606 | $174,394 |
| 2020 | $1,651 | $222,000 | $71,659 | $150,341 |
| 2019 | $1,582 | $210,000 | $70,243 | $139,757 |
| 2018 | $1,462 | $189,000 | $59,230 | $129,770 |
| 2016 | $1,363 | $92,125 | $25,365 | $66,760 |
| 2015 | $1,315 | $82,720 | $25,365 | $57,355 |
| 2014 | $1,455 | $95,019 | $25,365 | $69,654 |
| 2013 | -- | $89,883 | $34,101 | $55,782 |
Source: Public Records
Map
Nearby Homes
- 1021 E 1225 S Unit A
- 990 E 1150 S
- 1184 E Valhalla Dr
- 1127 E 1050 S
- 897 E 1000 S
- 842 E 1000 S
- 1520 E 1100 S
- 876 S 1000 E
- 1596 N Main St Unit 2
- 1916 N Celia Way
- 911 S 1500 E
- 1740 N Gregory Dr
- 1847 John St
- 1606 W 1960 N
- 1648 W 1920 N
- 908 S 550 E
- 1896 Cliff Place
- 1560 E 800 S Unit C
- 1543 E 750 S Unit C5
- 870 S 1625 E Unit A
Your Personal Tour Guide
Ask me questions while you tour the home.