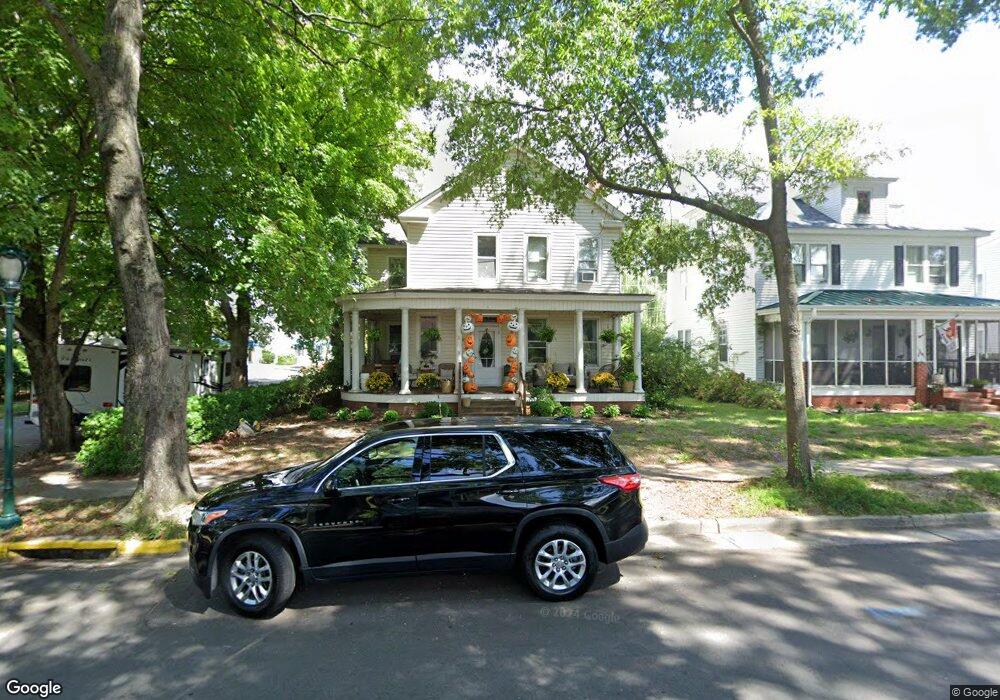
1126 Main St West Point, VA 23181
Estimated Value: $328,200 - $385,000
3
Beds
4
Baths
2,692
Sq Ft
$133/Sq Ft
Est. Value
About This Home
This home is located at 1126 Main St, West Point, VA 23181 and is currently estimated at $358,300, approximately $133 per square foot. 1126 Main St is a home located in King William County with nearby schools including West Point Elementary School, West Point Middle School, and West Point High School.
Ownership History
Date
Name
Owned For
Owner Type
Purchase Details
Closed on
Jan 16, 2017
Sold by
Hockman Maurine O
Bought by
Saamsing Robert K
Current Estimated Value
Home Financials for this Owner
Home Financials are based on the most recent Mortgage that was taken out on this home.
Original Mortgage
$217,979
Outstanding Balance
$179,839
Interest Rate
4.16%
Mortgage Type
FHA
Estimated Equity
$178,461
Purchase Details
Closed on
Aug 19, 2015
Sold by
Hockamn Maurine O
Bought by
Freeland Maurine Alison H
Create a Home Valuation Report for This Property
The Home Valuation Report is an in-depth analysis detailing your home's value as well as a comparison with similar homes in the area
Home Values in the Area
Average Home Value in this Area
Purchase History
| Date | Buyer | Sale Price | Title Company |
|---|---|---|---|
| Saamsing Robert K | $222,000 | Barristers Of Va | |
| Freeland Maurine Alison H | -- | None Available |
Source: Public Records
Mortgage History
| Date | Status | Borrower | Loan Amount |
|---|---|---|---|
| Open | Saamsing Robert K | $217,979 |
Source: Public Records
Tax History Compared to Growth
Tax History
| Year | Tax Paid | Tax Assessment Tax Assessment Total Assessment is a certain percentage of the fair market value that is determined by local assessors to be the total taxable value of land and additions on the property. | Land | Improvement |
|---|---|---|---|---|
| 2025 | $842 | $276,000 | $30,000 | $246,000 |
| 2024 | $745 | $276,000 | $30,000 | $246,000 |
| 2023 | $745 | $276,000 | $30,000 | $246,000 |
| 2022 | $679 | $181,000 | $30,000 | $151,000 |
| 2021 | $688 | $181,000 | $30,000 | $151,000 |
| 2020 | $688 | $227,900 | $27,000 | $200,900 |
| 2019 | $688 | $172,400 | $30,000 | $142,400 |
| 2018 | $706 | $181,000 | $30,000 | $151,000 |
| 2017 | $733 | $181,000 | $30,000 | $151,000 |
| 2016 | $742 | $181,000 | $30,000 | $151,000 |
| 2015 | $778 | $181,000 | $30,000 | $151,000 |
| 2014 | $869 | $0 | $0 | $0 |
Source: Public Records
Map
Nearby Homes