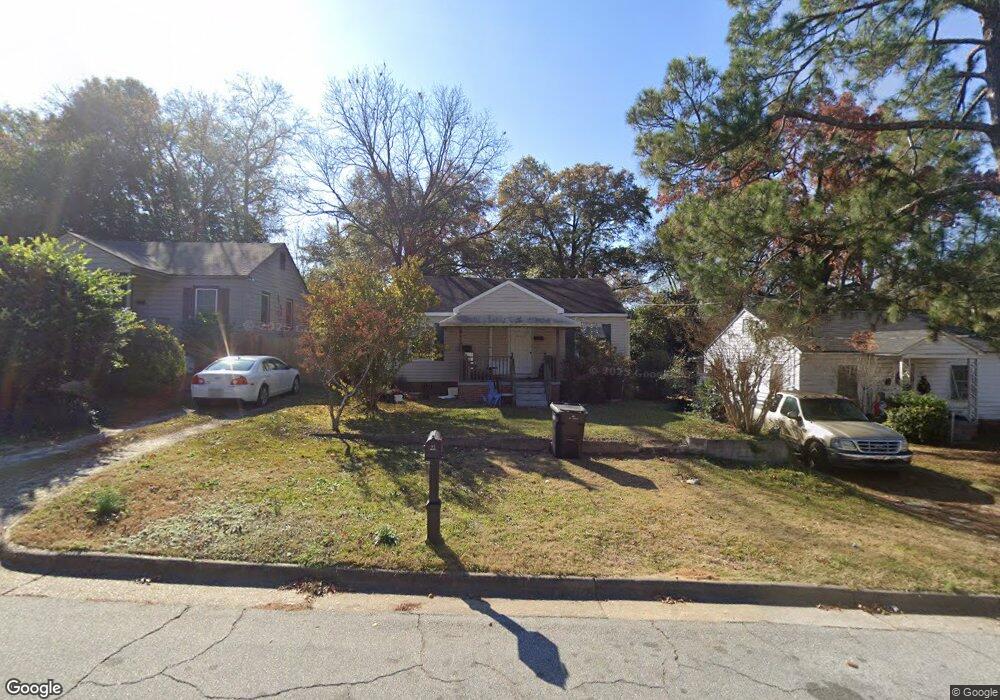
1126 Neill Dr Columbus, GA 31904
North Highlands NeighborhoodEstimated Value: $50,000 - $78,000
2
Beds
2
Baths
877
Sq Ft
$75/Sq Ft
Est. Value
About This Home
This home is located at 1126 Neill Dr, Columbus, GA 31904 and is currently estimated at $65,485, approximately $74 per square foot. 1126 Neill Dr is a home located in Muscogee County with nearby schools including Johnson Elementary School, Arnold Middle School, and Jordan Vocational High School.
Ownership History
Date
Name
Owned For
Owner Type
Purchase Details
Closed on
Dec 19, 2016
Sold by
Constance S
Bought by
Csp Investments Llc
Current Estimated Value
Purchase Details
Closed on
Sep 6, 2016
Bought by
Sec Of Housing & Urban
Purchase Details
Closed on
May 22, 2008
Sold by
Cummings Ricky N
Bought by
Crittenden Kenneth
Home Financials for this Owner
Home Financials are based on the most recent Mortgage that was taken out on this home.
Original Mortgage
$68,820
Interest Rate
6%
Mortgage Type
FHA
Purchase Details
Closed on
Nov 26, 2007
Sold by
Rp Investment Group Llc
Bought by
Cummings Ricky N
Home Financials for this Owner
Home Financials are based on the most recent Mortgage that was taken out on this home.
Original Mortgage
$41,600
Interest Rate
6.29%
Create a Home Valuation Report for This Property
The Home Valuation Report is an in-depth analysis detailing your home's value as well as a comparison with similar homes in the area
Home Values in the Area
Average Home Value in this Area
Purchase History
| Date | Buyer | Sale Price | Title Company |
|---|---|---|---|
| Csp Investments Llc | -- | -- | |
| Philips Constance S | -- | -- | |
| Sec Of Housing & Urban | $29,750 | -- | |
| Jpmorgan Chase Bank National A | $29,750 | -- | |
| Crittenden Kenneth | $69,900 | None Available | |
| Cummings Ricky N | $28,500 | None Available | |
| Rp Investment Group Llc | $19,000 | None Available |
Source: Public Records
Mortgage History
| Date | Status | Borrower | Loan Amount |
|---|---|---|---|
| Previous Owner | Crittenden Kenneth | $68,820 | |
| Previous Owner | Cummings Ricky N | $41,600 |
Source: Public Records
Tax History Compared to Growth
Tax History
| Year | Tax Paid | Tax Assessment Tax Assessment Total Assessment is a certain percentage of the fair market value that is determined by local assessors to be the total taxable value of land and additions on the property. | Land | Improvement |
|---|---|---|---|---|
| 2025 | $644 | $28,924 | $4,996 | $23,928 |
| 2024 | $644 | $16,464 | $3,496 | $12,968 |
| 2023 | $649 | $16,464 | $3,496 | $12,968 |
| 2022 | $571 | $16,464 | $3,496 | $12,968 |
| 2021 | $610 | $14,944 | $3,496 | $11,448 |
| 2020 | $610 | $14,944 | $3,496 | $11,448 |
| 2019 | $612 | $14,944 | $3,496 | $11,448 |
| 2018 | $612 | $14,944 | $3,496 | $11,448 |
| 2017 | $614 | $14,944 | $3,496 | $11,448 |
| 2016 | $606 | $27,951 | $2,159 | $25,792 |
| 2015 | $607 | $27,951 | $2,159 | $25,792 |
| 2014 | $608 | $27,951 | $2,159 | $25,792 |
| 2013 | -- | $27,951 | $2,159 | $25,792 |
Source: Public Records
Map
Nearby Homes