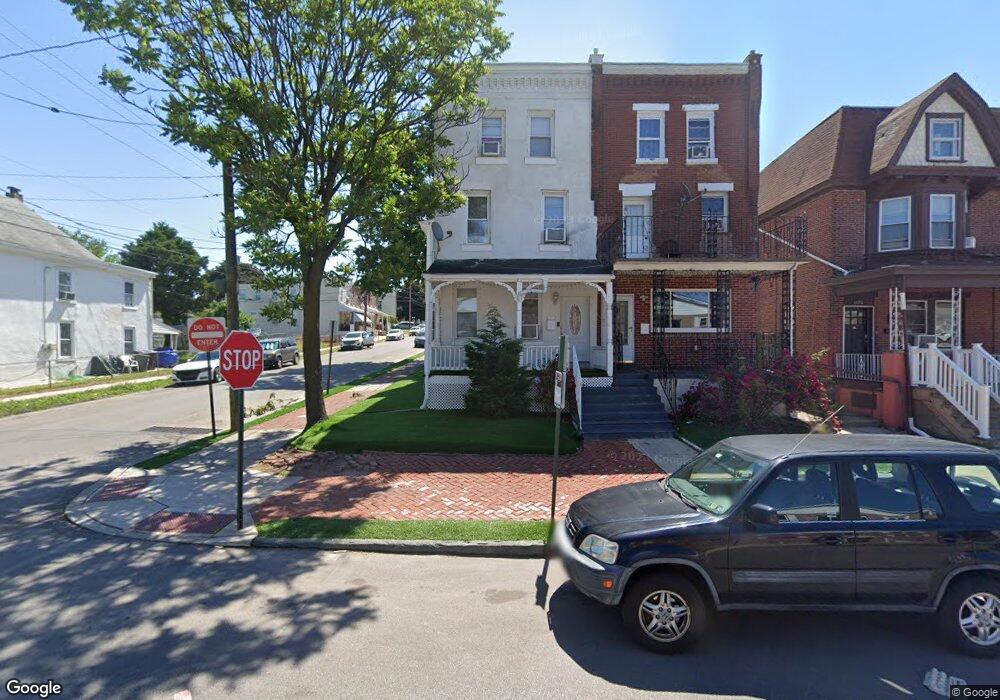
1126 Swede St Norristown, PA 19401
Estimated Value: $167,000 - $211,000
4
Beds
1
Bath
1,816
Sq Ft
$106/Sq Ft
Est. Value
About This Home
This home is located at 1126 Swede St, Norristown, PA 19401 and is currently estimated at $191,718, approximately $105 per square foot. 1126 Swede St is a home located in Montgomery County with nearby schools including Hancock Elementary School, Charles Blockson Middle School, and East Norriton Middle School.
Ownership History
Date
Name
Owned For
Owner Type
Purchase Details
Closed on
Jun 1, 2007
Sold by
Chicco Frank R
Bought by
Zarco Ricardo and Tzompantzi Maria Carmen
Current Estimated Value
Home Financials for this Owner
Home Financials are based on the most recent Mortgage that was taken out on this home.
Original Mortgage
$110,000
Outstanding Balance
$67,308
Interest Rate
6.19%
Estimated Equity
$124,410
Purchase Details
Closed on
Apr 29, 1998
Sold by
Associates Financial Services Co Inc
Bought by
Chicco Frank R
Purchase Details
Closed on
Jan 31, 1998
Sold by
Lorenz John
Bought by
Associates Financial Services Co Inc
Purchase Details
Closed on
Dec 19, 1995
Sold by
Meridian Mtg Corp
Bought by
Lorenz John
Purchase Details
Closed on
Nov 3, 1995
Sold by
Hud
Bought by
Meridian Mtg Corp
Purchase Details
Closed on
Jul 17, 1995
Sold by
Meridian Mtg Corp
Bought by
Hud
Create a Home Valuation Report for This Property
The Home Valuation Report is an in-depth analysis detailing your home's value as well as a comparison with similar homes in the area
Home Values in the Area
Average Home Value in this Area
Purchase History
| Date | Buyer | Sale Price | Title Company |
|---|---|---|---|
| Zarco Ricardo | $110,000 | None Available | |
| Chicco Frank R | $28,000 | -- | |
| Associates Financial Services Co Inc | -- | -- | |
| Lorenz John | $20,000 | -- | |
| Meridian Mtg Corp | -- | -- | |
| Hud | $69,819 | -- |
Source: Public Records
Mortgage History
| Date | Status | Borrower | Loan Amount |
|---|---|---|---|
| Open | Zarco Ricardo | $110,000 |
Source: Public Records
Tax History Compared to Growth
Tax History
| Year | Tax Paid | Tax Assessment Tax Assessment Total Assessment is a certain percentage of the fair market value that is determined by local assessors to be the total taxable value of land and additions on the property. | Land | Improvement |
|---|---|---|---|---|
| 2025 | $4,011 | $65,360 | $21,750 | $43,610 |
| 2024 | $4,011 | $65,360 | $21,750 | $43,610 |
| 2023 | $3,975 | $65,360 | $21,750 | $43,610 |
| 2022 | $3,890 | $65,360 | $21,750 | $43,610 |
| 2021 | $3,871 | $65,360 | $21,750 | $43,610 |
| 2020 | $3,693 | $65,360 | $21,750 | $43,610 |
| 2019 | $3,625 | $65,360 | $21,750 | $43,610 |
| 2018 | $2,166 | $65,360 | $21,750 | $43,610 |
| 2017 | $3,329 | $65,360 | $21,750 | $43,610 |
| 2016 | $3,304 | $65,360 | $21,750 | $43,610 |
| 2015 | $3,165 | $65,360 | $21,750 | $43,610 |
| 2014 | $3,165 | $65,360 | $21,750 | $43,610 |
Source: Public Records
Map
Nearby Homes
- 52 W Basin St
- 16 W Spruce St
- 105 W Wood St
- 1031 Swede St
- 231 W Spruce St
- 7 E Basin St
- 1035 Willow St
- 332 James St
- 1326 Markley St
- 43 E Wood St
- 1009 Dekalb St
- 1313 Dekalb St
- 1844 Arbor Place Dr Unit 45S
- 1836 Arbor Place Dr Unit 41W
- 1852 Arbor Place Dr Unit 49S
- 1313 Astor St
- 1418 Pine St
- 239 W Fornance St
- 1000 Dekalb St Unit 6
- 1339 Dekalb St