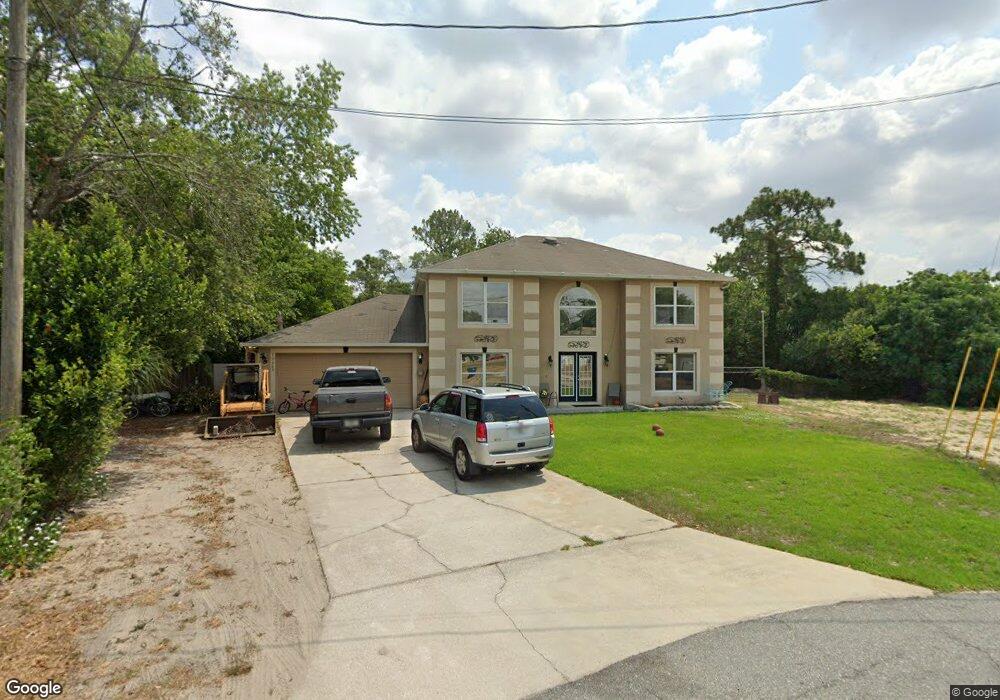
11269 Claymore St Spring Hill, FL 34609
Estimated Value: $370,613 - $395,000
4
Beds
2
Baths
2,342
Sq Ft
$162/Sq Ft
Est. Value
About This Home
This home is located at 11269 Claymore St, Spring Hill, FL 34609 and is currently estimated at $379,403, approximately $161 per square foot. 11269 Claymore St is a home located in Hernando County with nearby schools including John D. Floyd Elementary School, Powell Middle School, and Frank W. Springstead High School.
Ownership History
Date
Name
Owned For
Owner Type
Purchase Details
Closed on
May 8, 2016
Sold by
Hendrickson Brian J and Hendrickson Patricia K
Bought by
Henrickson Brian J and Hendrickson Patricia K
Current Estimated Value
Purchase Details
Closed on
Sep 11, 2003
Sold by
Patino Troy P
Bought by
Vohwinkle Ken and Vohwinkle Robin
Home Financials for this Owner
Home Financials are based on the most recent Mortgage that was taken out on this home.
Original Mortgage
$133,712
Outstanding Balance
$62,413
Interest Rate
6.33%
Estimated Equity
$316,990
Purchase Details
Closed on
Apr 21, 2003
Sold by
Maronda Homes Inc Fl
Bought by
Patino Troy P
Home Financials for this Owner
Home Financials are based on the most recent Mortgage that was taken out on this home.
Original Mortgage
$102,767
Interest Rate
5.79%
Mortgage Type
FHA
Purchase Details
Closed on
Aug 20, 2002
Sold by
Richardson Margaret J and Richardson Johnstone B
Bought by
Maronda Homes Inc
Create a Home Valuation Report for This Property
The Home Valuation Report is an in-depth analysis detailing your home's value as well as a comparison with similar homes in the area
Home Values in the Area
Average Home Value in this Area
Purchase History
| Date | Buyer | Sale Price | Title Company |
|---|---|---|---|
| Henrickson Brian J | $32,500 | Attorney | |
| Vohwinkle Ken | $140,800 | -- | |
| Patino Troy P | $103,600 | -- | |
| Maronda Homes Inc | $7,000 | -- |
Source: Public Records
Mortgage History
| Date | Status | Borrower | Loan Amount |
|---|---|---|---|
| Open | Vohwinkle Ken | $133,712 | |
| Previous Owner | Patino Troy P | $102,767 |
Source: Public Records
Tax History Compared to Growth
Tax History
| Year | Tax Paid | Tax Assessment Tax Assessment Total Assessment is a certain percentage of the fair market value that is determined by local assessors to be the total taxable value of land and additions on the property. | Land | Improvement |
|---|---|---|---|---|
| 2024 | $1,884 | $126,171 | -- | -- |
| 2023 | $1,884 | $122,496 | $0 | $0 |
| 2022 | $1,791 | $118,928 | $0 | $0 |
| 2021 | $1,244 | $115,464 | $0 | $0 |
| 2020 | $1,661 | $113,870 | $0 | $0 |
| 2019 | $1,655 | $111,310 | $0 | $0 |
| 2018 | $1,069 | $109,235 | $0 | $0 |
| 2017 | $1,343 | $106,988 | $0 | $0 |
| 2016 | $1,298 | $104,787 | $0 | $0 |
| 2015 | $1,304 | $104,059 | $0 | $0 |
| 2014 | $1,262 | $103,233 | $0 | $0 |
Source: Public Records
Map
Nearby Homes
- 11272 Portsmouth St
- 11224 Portsmouth St
- 11278 Redgate St
- 11298 Redgate St
- 2485 Stanton Ave
- 11334 Redgate St
- 0 Stanton Ave
- 11421 Portsmouth St
- 0 Lake Forest Ave
- 2394 Lema Dr
- 2270 Amherst Ave
- 0 Amherst Ave
- 2253 Estill Ave
- 11256 Holbrook St
- 2412 Mariner Blvd
- 3046 Rim Dr
- 11175 Marquette St
- 2469 Mariner Blvd
- 2473 Mariner Blvd
- 2319 Canfield Dr
- 2400 Statler Ave
- 11256 Portsmouth St
- 11264 Portsmouth St
- 11268 Claymore St
- 11248 Portsmouth St
- 11260 Claymore St
- 10325 Claymore St
- Lot 2 Claymore St
- 0 Claymore St
- 10442 Claymore St
- 11017 Claymore St
- 2401 Statler Ave
- 11269 Redgate St
- 00 Statler Ave
- 0 Statler Ave
- 11279 Redgate St
- 11232 Portsmouth St
- 11257 Portsmouth St
- 11263 Portsmouth St
- 11261 Redgate St