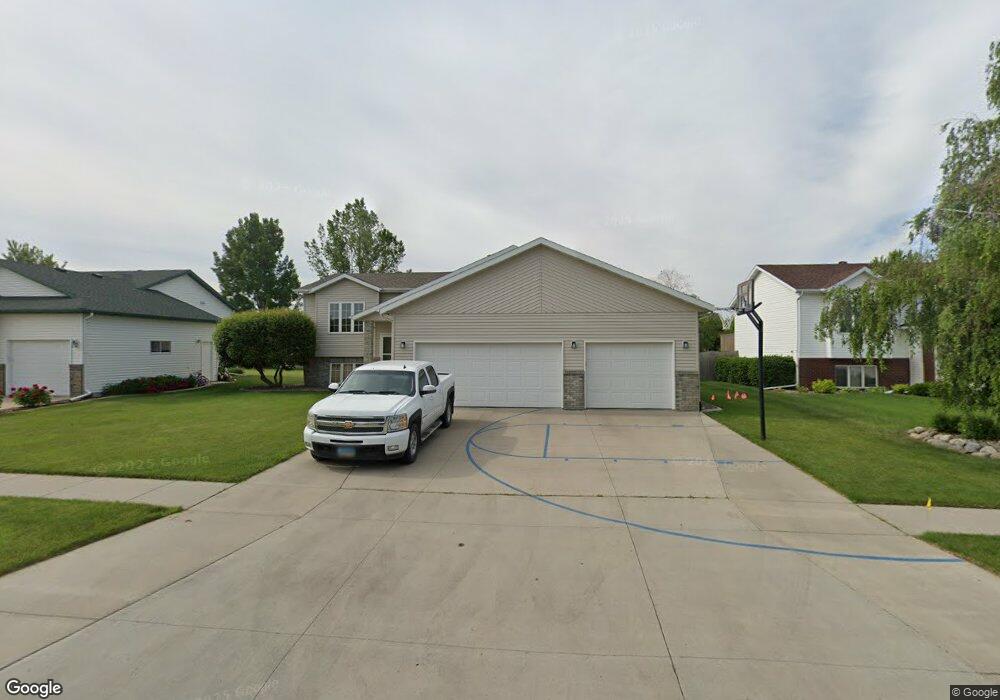
1127 6th Ave W West Fargo, ND 58078
Westwynd NeighborhoodEstimated Value: $376,000
2
Beds
2
Baths
2,400
Sq Ft
$157/Sq Ft
Est. Value
About This Home
This home is located at 1127 6th Ave W, West Fargo, ND 58078 and is currently estimated at $376,000, approximately $156 per square foot. 1127 6th Ave W is a home located in Cass County with nearby schools including Westside Elementary School, Cheney Middle School, and West Fargo High School.
Ownership History
Date
Name
Owned For
Owner Type
Purchase Details
Closed on
Jul 15, 2009
Sold by
Adams Leroy R and Adams Angela K
Bought by
Rudolph Veronica M and Rudolph Glenn R
Current Estimated Value
Create a Home Valuation Report for This Property
The Home Valuation Report is an in-depth analysis detailing your home's value as well as a comparison with similar homes in the area
Home Values in the Area
Average Home Value in this Area
Purchase History
| Date | Buyer | Sale Price | Title Company |
|---|---|---|---|
| Rudolph Veronica M | -- | -- |
Source: Public Records
Tax History Compared to Growth
Tax History
| Year | Tax Paid | Tax Assessment Tax Assessment Total Assessment is a certain percentage of the fair market value that is determined by local assessors to be the total taxable value of land and additions on the property. | Land | Improvement |
|---|---|---|---|---|
| 2024 | $4,405 | $171,300 | $22,650 | $148,650 |
| 2023 | $4,819 | $167,900 | $22,650 | $145,250 |
| 2022 | $4,729 | $157,800 | $22,650 | $135,150 |
| 2021 | $4,503 | $144,550 | $20,750 | $123,800 |
| 2020 | $4,173 | $136,600 | $20,750 | $115,850 |
| 2019 | $4,048 | $131,950 | $20,750 | $111,200 |
| 2018 | $3,858 | $130,800 | $20,750 | $110,050 |
| 2017 | $3,645 | $129,700 | $20,750 | $108,950 |
| 2016 | $3,098 | $125,950 | $20,750 | $105,200 |
| 2015 | $3,009 | $112,500 | $12,000 | $100,500 |
| 2014 | $2,937 | $105,150 | $12,000 | $93,150 |
| 2013 | $2,836 | $102,450 | $12,000 | $90,450 |
Source: Public Records
Map
Nearby Homes