Estimated Value: $188,934 - $246,000
3
Beds
1
Bath
1,738
Sq Ft
$127/Sq Ft
Est. Value
About This Home
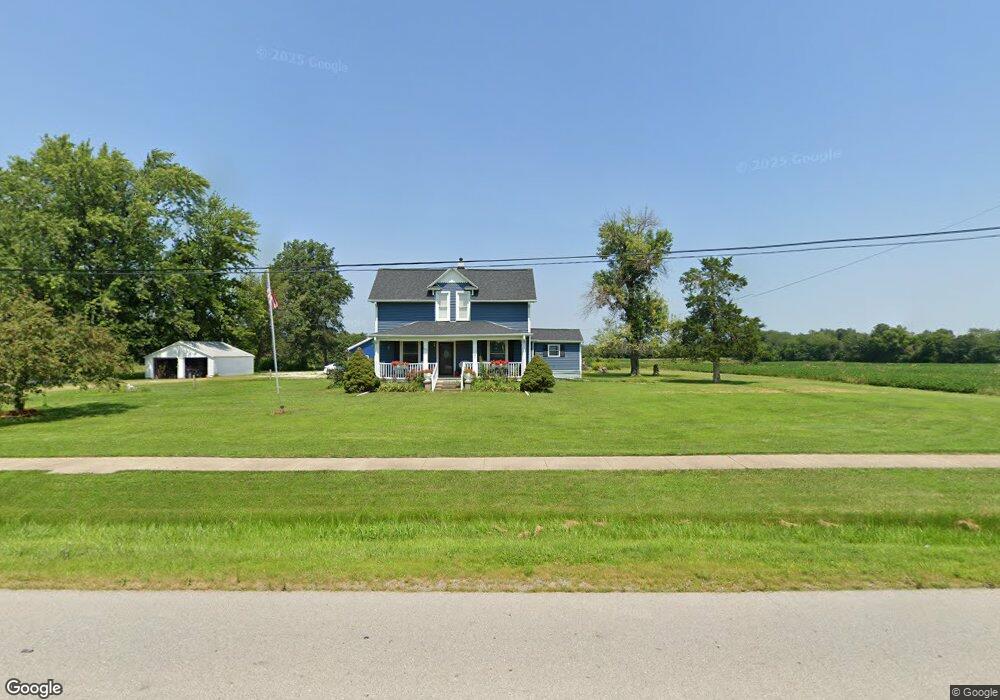
This home is located at 1127 E Main St, Perry, MO 63462 and is currently estimated at $219,984, approximately $126 per square foot. 1127 E Main St is a home with nearby schools including Mark Twain Senior High School and Perry Christian Academy.
Ownership History
Date
Name
Owned For
Owner Type
Purchase Details
Closed on
Nov 25, 2025
Sold by
Mcdonald Charles A and Mcdonald Terry L
Bought by
Brokes John F and Brokes Lisa M
Current Estimated Value
Home Financials for this Owner
Home Financials are based on the most recent Mortgage that was taken out on this home.
Original Mortgage
$227,905
Outstanding Balance
$227,473
Interest Rate
6.27%
Mortgage Type
New Conventional
Estimated Equity
-$7,489
Purchase Details
Closed on
May 21, 2021
Sold by
Rudman Ken E and Rudman Karen A
Bought by
Mcdonald Charles A and Mcdonald Terry L
Home Financials for this Owner
Home Financials are based on the most recent Mortgage that was taken out on this home.
Original Mortgage
$196,840
Interest Rate
3.1%
Mortgage Type
VA
Purchase Details
Closed on
Jun 2, 2020
Sold by
Ladjcd Llc
Bought by
Rudman Ken E and Rudman Karen A
Create a Home Valuation Report for This Property
The Home Valuation Report is an in-depth analysis detailing your home's value as well as a comparison with similar homes in the area
Purchase History
| Date | Buyer | Sale Price | Title Company |
|---|---|---|---|
| Brokes John F | -- | None Listed On Document | |
| Mcdonald Charles A | -- | None Available | |
| Rudman Ken E | -- | None Available |
Source: Public Records
Mortgage History
| Date | Status | Borrower | Loan Amount |
|---|---|---|---|
| Open | Brokes John F | $227,905 | |
| Previous Owner | Mcdonald Charles A | $196,840 |
Source: Public Records
Tax History
| Year | Tax Paid | Tax Assessment Tax Assessment Total Assessment is a certain percentage of the fair market value that is determined by local assessors to be the total taxable value of land and additions on the property. | Land | Improvement |
|---|---|---|---|---|
| 2025 | $837 | $18,890 | $4,530 | $14,360 |
| 2024 | $801 | $16,490 | $3,950 | $12,540 |
| 2023 | $777 | $16,490 | $3,950 | $12,540 |
| 2022 | $673 | $14,280 | $3,950 | $10,330 |
| 2021 | $677 | $14,280 | $3,950 | $10,330 |
| 2020 | $685 | $14,280 | $3,950 | $10,330 |
| 2019 | $658 | $14,280 | $3,950 | $10,330 |
| 2018 | $426 | $9,180 | $3,950 | $5,230 |
| 2017 | $425 | $9,180 | $3,950 | $5,230 |
| 2016 | $423 | $9,180 | $3,950 | $5,230 |
| 2015 | -- | $8,950 | $3,950 | $5,000 |
| 2014 | -- | $9,100 | $1,270 | $7,830 |
| 2013 | -- | $9,100 | $1,270 | $7,830 |
Source: Public Records
Map
Nearby Homes
Your Personal Tour Guide
Ask me questions while you tour the home.