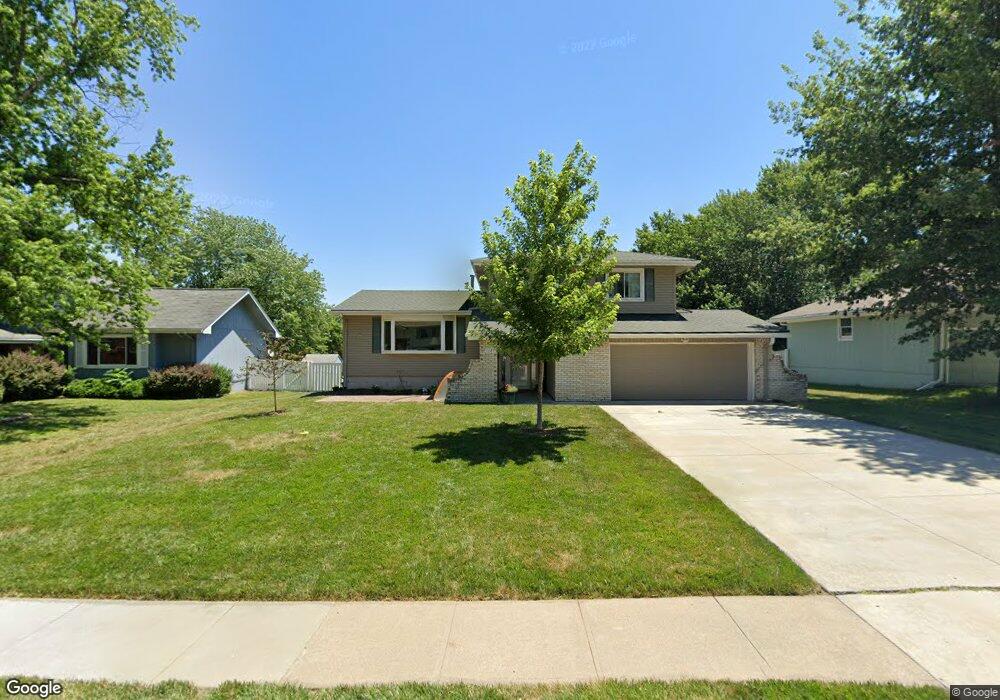
1127 Laport Dr Papillion, NE 68046
Estimated Value: $305,338 - $326,000
3
Beds
3
Baths
2,252
Sq Ft
$142/Sq Ft
Est. Value
About This Home
This home is located at 1127 Laport Dr, Papillion, NE 68046 and is currently estimated at $318,835, approximately $141 per square foot. 1127 Laport Dr is a home located in Sarpy County with nearby schools including Carriage Hill Elementary School, Papillion Middle School, and Papillion La Vista South High School.
Ownership History
Date
Name
Owned For
Owner Type
Purchase Details
Closed on
Aug 28, 2017
Sold by
Pocky James Robert and Pocky Lori
Bought by
Debusk Skip Wayne and Debusk Kyle Coreen
Current Estimated Value
Home Financials for this Owner
Home Financials are based on the most recent Mortgage that was taken out on this home.
Original Mortgage
$178,825
Outstanding Balance
$149,412
Interest Rate
3.92%
Mortgage Type
FHA
Estimated Equity
$169,423
Purchase Details
Closed on
May 31, 2012
Sold by
Searcy Timothy
Bought by
Pocky James Robert
Purchase Details
Closed on
Dec 2, 2009
Sold by
Searcy Anne
Bought by
Searcy Timothy
Purchase Details
Closed on
Jun 24, 2002
Sold by
Hoins Daniel E and Hoins Leah C
Bought by
Searcy Timothy and Searcy Anne
Home Financials for this Owner
Home Financials are based on the most recent Mortgage that was taken out on this home.
Original Mortgage
$153,000
Interest Rate
6.62%
Mortgage Type
VA
Create a Home Valuation Report for This Property
The Home Valuation Report is an in-depth analysis detailing your home's value as well as a comparison with similar homes in the area
Home Values in the Area
Average Home Value in this Area
Purchase History
| Date | Buyer | Sale Price | Title Company |
|---|---|---|---|
| Debusk Skip Wayne | $185,000 | Nebraska Title Co | |
| Pocky James Robert | $160,000 | Prestige Title & Escrow | |
| Searcy Timothy | -- | None Available | |
| Searcy Timothy | $150,000 | -- |
Source: Public Records
Mortgage History
| Date | Status | Borrower | Loan Amount |
|---|---|---|---|
| Open | Debusk Skip Wayne | $178,825 | |
| Previous Owner | Searcy Timothy | $153,000 |
Source: Public Records
Tax History
| Year | Tax Paid | Tax Assessment Tax Assessment Total Assessment is a certain percentage of the fair market value that is determined by local assessors to be the total taxable value of land and additions on the property. | Land | Improvement |
|---|---|---|---|---|
| 2025 | $3,821 | $279,253 | $45,000 | $234,253 |
| 2024 | $4,597 | $257,675 | $40,000 | $217,675 |
| 2023 | $4,597 | $244,118 | $40,000 | $204,118 |
| 2022 | $4,343 | $212,816 | $35,000 | $177,816 |
| 2021 | $3,939 | $189,219 | $30,000 | $159,219 |
| 2020 | $3,946 | $187,659 | $29,000 | $158,659 |
| 2019 | $3,814 | $181,486 | $29,000 | $152,486 |
| 2018 | $3,677 | $172,294 | $22,000 | $150,294 |
| 2017 | $3,618 | $169,609 | $22,000 | $147,609 |
| 2016 | $3,533 | $165,858 | $22,000 | $143,858 |
| 2015 | $3,350 | $157,743 | $22,000 | $135,743 |
| 2014 | $3,301 | $154,358 | $22,000 | $132,358 |
| 2012 | -- | $154,099 | $22,000 | $132,099 |
Source: Public Records
Map
Nearby Homes
- 1107 Patricia Dr
- 1021 Patricia Dr
- 1101 Patricia Dr
- 1005 Patricia Dr
- 1009 Patricia Dr
- 1103 Patricia Dr
- 1017 Patricia Dr
- 1019 Patricia Dr
- 1023 Patricia Dr
- 1011 Patricia Dr
- 1003 Patricia Dr
- 1007 Patricia Dr
- 1113 Hackney Dr
- 921 Arlene Cir
- 1114 Hackney Dr
- 1015 Patricia Dr
- 1013 Patricia Dr
- 1001 Patricia Dr
- 1512 Beechwood Ave
- 11908 S 110th St
- 1127 La Port Dr
- 1125 Laport Dr
- 1125 La Port Dr
- 1129 La Port Dr
- 1123 La Port Dr
- 1136 Michelle Pkwy
- 1134 Michelle Pkwy
- 1126 La Port Dr
- 1128 La Port Dr
- 1132 Michelle Pkwy
- 1121 La Port Dr
- 1130 Laport Dr
- 1124 La Port Dr
- 1130 La Port Dr
- 903 Renee Dr
- 1122 Laport Dr
- 1130 Michelle Pkwy
- 1122 La Port Dr
- 822 Spruce Dr
- 820 Spruce Dr
Your Personal Tour Guide
Ask me questions while you tour the home.