Estimated Value: $182,703 - $297,000
--
Bed
--
Bath
1,008
Sq Ft
$224/Sq Ft
Est. Value
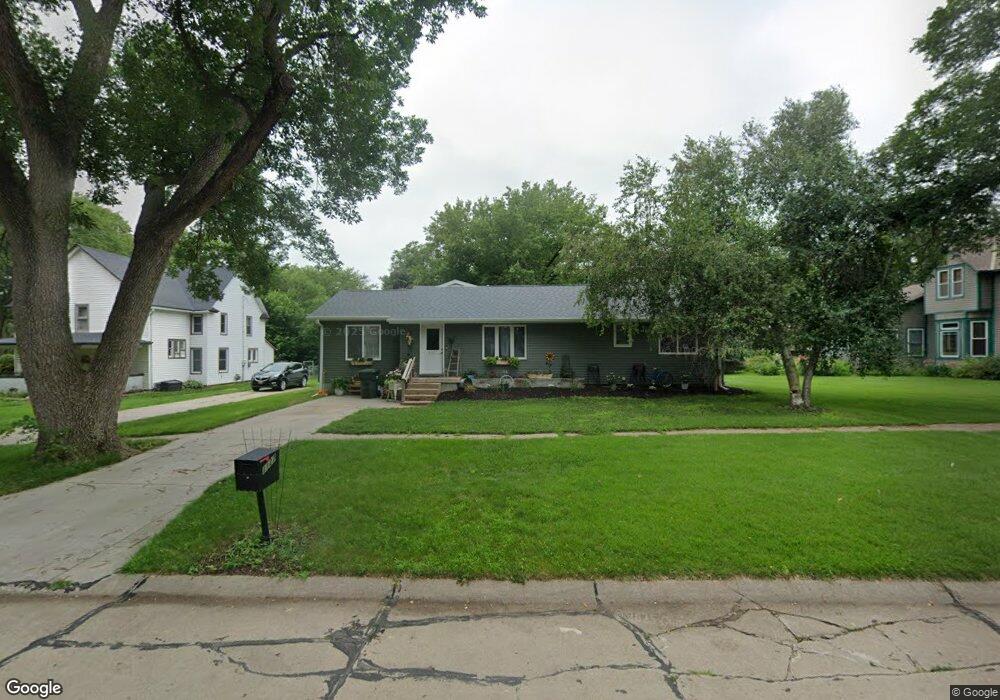
About This Home
This home is located at 1127 N Locust St, Wahoo, NE 68066 and is currently estimated at $225,676, approximately $223 per square foot. 1127 N Locust St is a home located in Saunders County with nearby schools including Wahoo Elementary School, Wahoo Middle School, and Wahoo High School.
Ownership History
Date
Name
Owned For
Owner Type
Purchase Details
Closed on
Apr 12, 2021
Sold by
Amirfathi Lucy
Bought by
Zulu Properties Llc
Current Estimated Value
Home Financials for this Owner
Home Financials are based on the most recent Mortgage that was taken out on this home.
Original Mortgage
$69,750
Outstanding Balance
$63,026
Interest Rate
3.05%
Mortgage Type
New Conventional
Estimated Equity
$162,650
Purchase Details
Closed on
Oct 26, 2011
Sold by
Lynn Otter Michael and Lynn Hansson,Otte
Bought by
Amirfathi Luci
Home Financials for this Owner
Home Financials are based on the most recent Mortgage that was taken out on this home.
Original Mortgage
$86,734
Interest Rate
4.13%
Purchase Details
Closed on
Oct 24, 2011
Sold by
Lynn Otter Michael and Lynn Hansson,Otte
Bought by
Amirfathi Luci
Home Financials for this Owner
Home Financials are based on the most recent Mortgage that was taken out on this home.
Original Mortgage
$86,734
Interest Rate
4.13%
Create a Home Valuation Report for This Property
The Home Valuation Report is an in-depth analysis detailing your home's value as well as a comparison with similar homes in the area
Home Values in the Area
Average Home Value in this Area
Purchase History
| Date | Buyer | Sale Price | Title Company |
|---|---|---|---|
| Zulu Properties Llc | $93,000 | None Available | |
| Amirfathi Luci | -- | -- | |
| Amirfathi Luci | -- | -- |
Source: Public Records
Mortgage History
| Date | Status | Borrower | Loan Amount |
|---|---|---|---|
| Open | Zulu Properties Llc | $69,750 | |
| Previous Owner | Amirfathi Luci | $86,734 | |
| Previous Owner | Amirfathi Luci | $86,734 |
Source: Public Records
Tax History Compared to Growth
Tax History
| Year | Tax Paid | Tax Assessment Tax Assessment Total Assessment is a certain percentage of the fair market value that is determined by local assessors to be the total taxable value of land and additions on the property. | Land | Improvement |
|---|---|---|---|---|
| 2024 | $2,352 | $169,432 | $28,710 | $140,722 |
| 2023 | $2,472 | $141,254 | $28,710 | $112,544 |
| 2022 | $2,026 | $108,014 | $28,710 | $79,304 |
| 2021 | $1,856 | $96,262 | $28,710 | $67,552 |
| 2020 | $1,825 | $94,062 | $28,710 | $65,352 |
| 2019 | $1,817 | $91,549 | $28,710 | $62,839 |
| 2018 | $1,751 | $84,460 | $28,710 | $55,750 |
| 2017 | $1,745 | $84,460 | $28,710 | $55,750 |
| 2016 | $1,590 | $75,810 | $28,400 | $47,410 |
| 2015 | $1,601 | $75,810 | $28,400 | $47,410 |
| 2014 | $1,630 | $75,810 | $28,400 | $47,410 |
| 2012 | $1,725 | $75,810 | $28,400 | $47,410 |
Source: Public Records
Map
Nearby Homes
- 1039 N Laurel St
- 720 W 10th St
- 565 W 10th St
- 878 W 8th St
- 820 W 15th St
- 1365 N Chestnut St
- 453 W 7th St
- 758 W Park Cir
- 651 W 16th St
- 122 E 10th St
- 2689 N Oak St
- 1561 N Linden St
- 453 W 4th St
- 1672 N Linden St
- 1775 17th Avenue Rd Unit 2.36 Acres
- 327 E 7th St
- 2186 N Linden St
- 2228 N Linden St
- 428 E 14th St
- 649 W 2nd St
- 1145 N Locust St
- 1117 N Locust St
- 2300 N Locust St
- 1159 N Locust St
- 706 W 11th St
- 1099 N Locust St
- 714 W 11th St
- 1130 N Locust St
- 1138 N Locust St
- 1120 N Locust St
- Lot 19 Locust St
- Lot 20 Locust St
- Lot 18 Locust St
- Lot 17 Locust St
- Lot 16 Locust St
- Lot 15 Locust St
- Lot 14 Locust St
- 1175 N Locust St
- 1146 N Locust St
- 1059 N Laurel St