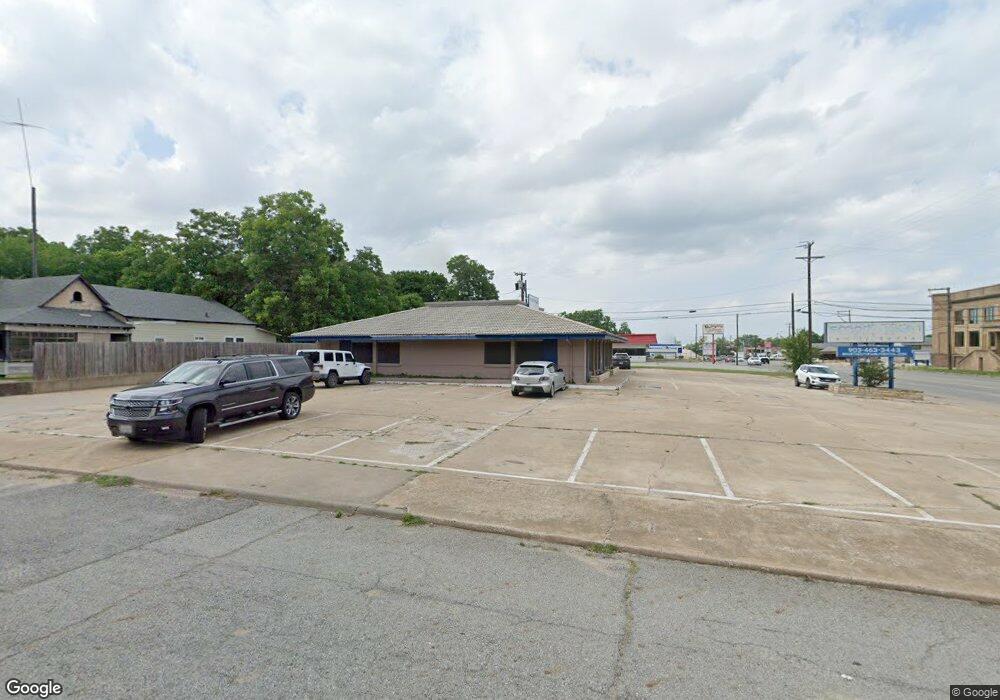
1127 S Austin Ave Denison, TX 75020
Estimated Value: $302,474
--
Bed
--
Bath
3,120
Sq Ft
$97/Sq Ft
Est. Value
About This Home
This home is located at 1127 S Austin Ave, Denison, TX 75020 and is currently estimated at $302,474, approximately $96 per square foot. 1127 S Austin Ave is a home located in Grayson County with nearby schools including Scott Middle School, Denison High School, and St. Luke's Parish Day School.
Ownership History
Date
Name
Owned For
Owner Type
Purchase Details
Closed on
Aug 15, 2022
Sold by
Hill Benjamin T and Hill Dori
Bought by
Us Agile Solutions Inc
Current Estimated Value
Home Financials for this Owner
Home Financials are based on the most recent Mortgage that was taken out on this home.
Original Mortgage
$333,000
Outstanding Balance
$281,386
Interest Rate
4.45%
Mortgage Type
New Conventional
Estimated Equity
$21,088
Purchase Details
Closed on
Feb 1, 2015
Sold by
Bogard Patricia M and Bogard Curtis D
Bought by
Hill Benjamin T and Hill Dori
Home Financials for this Owner
Home Financials are based on the most recent Mortgage that was taken out on this home.
Original Mortgage
$150,000
Interest Rate
3.89%
Mortgage Type
New Conventional
Create a Home Valuation Report for This Property
The Home Valuation Report is an in-depth analysis detailing your home's value as well as a comparison with similar homes in the area
Home Values in the Area
Average Home Value in this Area
Purchase History
| Date | Buyer | Sale Price | Title Company |
|---|---|---|---|
| Us Agile Solutions Inc | -- | New Title Company Name | |
| Hill Benjamin T | -- | None Available |
Source: Public Records
Mortgage History
| Date | Status | Borrower | Loan Amount |
|---|---|---|---|
| Open | Us Agile Solutions Inc | $333,000 | |
| Previous Owner | Hill Benjamin T | $150,000 |
Source: Public Records
Tax History Compared to Growth
Tax History
| Year | Tax Paid | Tax Assessment Tax Assessment Total Assessment is a certain percentage of the fair market value that is determined by local assessors to be the total taxable value of land and additions on the property. | Land | Improvement |
|---|---|---|---|---|
| 2025 | $8,362 | $359,914 | $105,749 | $254,165 |
| 2024 | $8,362 | $359,914 | $95,024 | $264,890 |
| 2023 | $6,949 | $306,734 | $92,021 | $214,713 |
| 2022 | $7,231 | $304,335 | $92,021 | $212,314 |
| 2021 | $5,026 | $199,291 | $40,112 | $159,179 |
| 2020 | $5,160 | $195,624 | $40,112 | $155,512 |
| 2019 | $5,383 | $195,624 | $40,112 | $155,512 |
| 2018 | $4,477 | $161,378 | $30,459 | $130,919 |
| 2017 | $4,277 | $152,884 | $30,459 | $122,425 |
| 2016 | $3,223 | $115,221 | $30,459 | $84,762 |
| 2015 | $3,372 | $119,363 | $30,459 | $88,904 |
| 2014 | $3,398 | $120,285 | $30,459 | $89,826 |
Source: Public Records
Map
Nearby Homes
- 221 W Monterey St
- 309 W Monterey St
- TBD S Austin Ave
- 330 W Texas St
- 231 W Murray St
- 1110 S Houston Ave
- 415 W Monterey St
- 111 W Murray St
- 408 W Heron St
- 328 W Murray St
- 101 E Murray St
- 129 Texas E
- 110 E Munson St
- 513 W Texas St
- 1414 S Houston Ave
- 326 W Day St
- 430 W Munson St
- 513 W Murray St
- 408 W Day St
- 511 W Munson St
- 211 W Monterey St
- 210 W Texas St
- 225 W Monterey St
- 225 W Monterey St Unit B
- 225 W Monterey St
- 225 W Monterey St Unit A
- 214 W Monterey St
- 1201 S Austin Ave
- 218 W Texas St
- 208 W Monterey St
- 229 W Monterey St
- 222 W Texas St
- 216 W Monterey St
- 226 W Monterey St
- 231 W Monterey St
- 226 W Texas St
- 228 W Monterey St
- 228 W Monterey St
- 1029 S Austin Ave
- 230 W Texas St