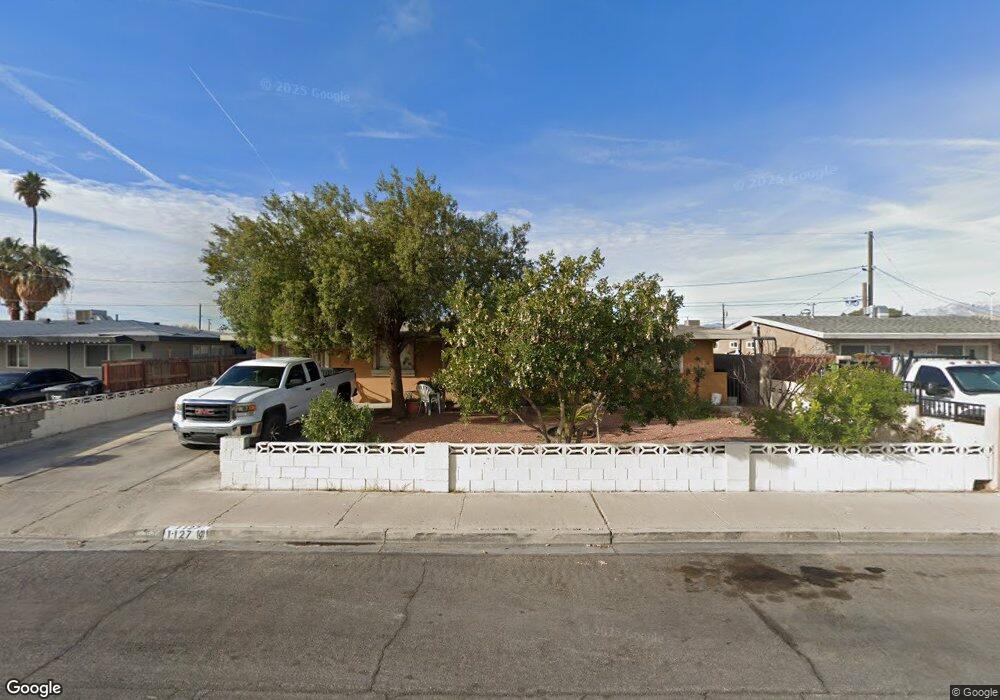
1127 Tamerack Ave Las Vegas, NV 89106
West Las Vegas NeighborhoodEstimated Value: $302,491 - $365,000
4
Beds
2
Baths
1,390
Sq Ft
$245/Sq Ft
Est. Value
About This Home
This home is located at 1127 Tamerack Ave, Las Vegas, NV 89106 and is currently estimated at $340,623, approximately $245 per square foot. 1127 Tamerack Ave is a home located in Clark County with nearby schools including Ollie Detwiler Elementary School, West Prepatory Academy At Charlles I West Hall Sec, and Western High School.
Ownership History
Date
Name
Owned For
Owner Type
Purchase Details
Closed on
Sep 14, 2009
Sold by
Cloyd Dennis and Cloyd Brian
Bought by
Garcia Gerardo and Garcia Epifanio
Current Estimated Value
Purchase Details
Closed on
May 19, 2008
Sold by
Torres Eleuterio and Torres Abelina
Bought by
Cloyd George and Cloyd Alice
Purchase Details
Closed on
Mar 15, 2006
Sold by
Torres Eleuterio
Bought by
Torres Abelina
Home Financials for this Owner
Home Financials are based on the most recent Mortgage that was taken out on this home.
Original Mortgage
$219,500
Interest Rate
6.19%
Mortgage Type
Seller Take Back
Purchase Details
Closed on
Jan 23, 2006
Sold by
Cloyd George and Cloyd Alice
Bought by
Torres Eleuterio and Torres Abelina
Home Financials for this Owner
Home Financials are based on the most recent Mortgage that was taken out on this home.
Original Mortgage
$219,500
Interest Rate
6.19%
Mortgage Type
Seller Take Back
Purchase Details
Closed on
Dec 18, 1996
Sold by
Toliver Edward
Bought by
Cloyd George and Cloyd Alice
Create a Home Valuation Report for This Property
The Home Valuation Report is an in-depth analysis detailing your home's value as well as a comparison with similar homes in the area
Home Values in the Area
Average Home Value in this Area
Purchase History
| Date | Buyer | Sale Price | Title Company |
|---|---|---|---|
| Garcia Gerardo | $52,000 | Equity Title Of Nevada | |
| Cloyd George | $219,500 | Nevada Title Las Vegas | |
| Torres Abelina | -- | Accommodation | |
| Torres Eleuterio | $219,500 | Nevada Title Company | |
| Cloyd George | $26,000 | United Title |
Source: Public Records
Mortgage History
| Date | Status | Borrower | Loan Amount |
|---|---|---|---|
| Previous Owner | Torres Eleuterio | $219,500 |
Source: Public Records
Tax History Compared to Growth
Tax History
| Year | Tax Paid | Tax Assessment Tax Assessment Total Assessment is a certain percentage of the fair market value that is determined by local assessors to be the total taxable value of land and additions on the property. | Land | Improvement |
|---|---|---|---|---|
| 2025 | $801 | $47,355 | $29,050 | $18,305 |
| 2024 | $743 | $47,355 | $29,050 | $18,305 |
| 2023 | $743 | $47,714 | $31,150 | $16,564 |
| 2022 | $688 | $38,570 | $23,800 | $14,770 |
| 2021 | $637 | $36,511 | $22,750 | $13,761 |
| 2020 | $589 | $31,917 | $18,550 | $13,367 |
| 2019 | $552 | $27,273 | $14,350 | $12,923 |
| 2018 | $527 | $24,359 | $12,250 | $12,109 |
| 2017 | $749 | $22,840 | $10,850 | $11,990 |
| 2016 | $494 | $20,322 | $8,750 | $11,572 |
| 2015 | $492 | $16,476 | $5,250 | $11,226 |
| 2014 | $477 | $14,132 | $3,500 | $10,632 |
Source: Public Records
Map
Nearby Homes
- 1106 Arrowhead Ave
- 1204 Arrowhead Ave
- 1103 Arrowhead Ave
- 1225 Arrowhead Ave
- 2624 Feather Cactus Ct
- 1101 Silver Lake Dr
- 2632 Chin Cactus Ct
- 1700 Ferrell St
- 2520 Bottle Palm Ct
- 2625 Chin Cactus Ct
- 913 Jade Plant St
- 1313 Purple Sage Ave
- 2521 Rainbow Cactus Ct
- 1112 Hazard Ave
- 3541 Arcadian Sea St
- 3494 Alpheus River Ave
- 3541 Alpheus River Ave
- 3534 Alpheus River Ave
- 3017 Holly Ave
- 1604 Luning Dr
- 1129 Tamerack Ave
- 1125 Tamerack Ave
- 1118 Tumbleweed Ave
- 1120 Tumbleweed Ave
- 1116 Tumbleweed Ave
- 1131 Tamerack Ave
- 1123 Tamerack Ave
- 1123 Tamerack Ave Unit na
- 1201 Cherokee Ln Unit 5
- 1122 Tumbleweed Ave
- 1114 Tumbleweed Ave
- 1200 Riverside Dr
- 1122 Tamerack Ave
- 1121 Tamerack Ave
- 1203 Cherokee Ln
- 1112 Tumbleweed Ave
- 1202 Riverside Dr
- 1120 Tamerack Ave
- 1117 Tumbleweed Ave
- 1119 Tumbleweed Ave