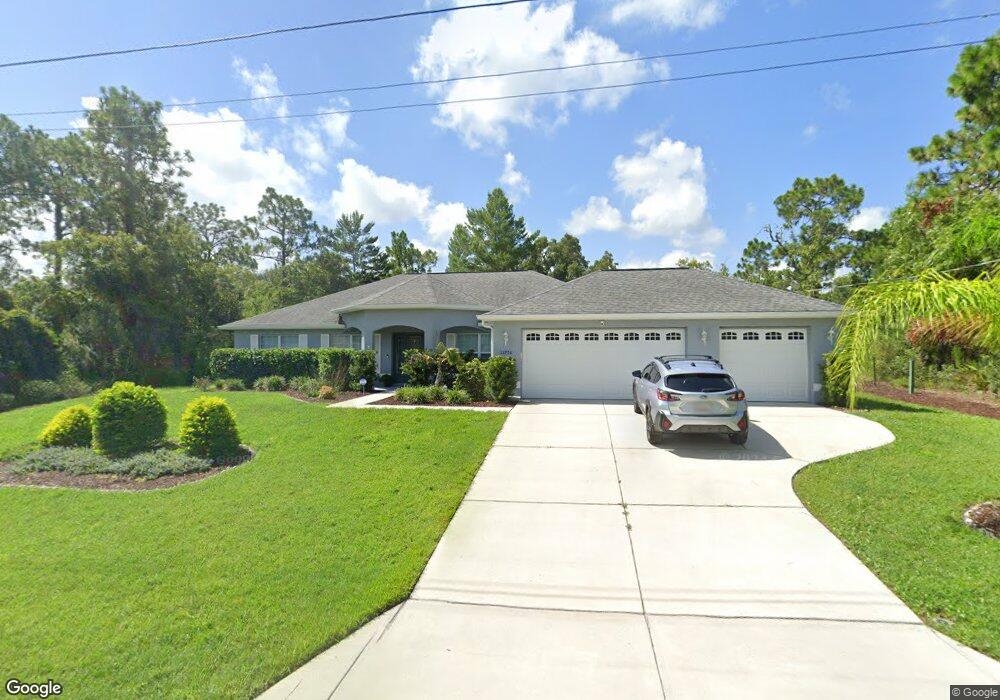
11270 Godwit Ave Weeki Wachee, FL 34613
Estimated Value: $386,000 - $496,000
3
Beds
2
Baths
1,955
Sq Ft
$214/Sq Ft
Est. Value
About This Home
This home is located at 11270 Godwit Ave, Weeki Wachee, FL 34613 and is currently estimated at $418,494, approximately $214 per square foot. 11270 Godwit Ave is a home with nearby schools including Winding Waters K-8 and Weeki Wachee High School.
Ownership History
Date
Name
Owned For
Owner Type
Purchase Details
Closed on
Dec 10, 2018
Sold by
Hartland Homes Inc
Bought by
Fletcher John James
Current Estimated Value
Home Financials for this Owner
Home Financials are based on the most recent Mortgage that was taken out on this home.
Original Mortgage
$151,900
Outstanding Balance
$133,827
Interest Rate
4.8%
Mortgage Type
New Conventional
Estimated Equity
$284,667
Purchase Details
Closed on
Sep 22, 2016
Sold by
Sanford Scott and Sanford Scott A
Bought by
Hartland Homes Inc
Purchase Details
Closed on
Jun 28, 2016
Sold by
Herbert Krista Lynn
Bought by
Sanford Scott A
Purchase Details
Closed on
Jun 25, 2016
Sold by
Herbert Jessica Rose
Bought by
Sanford Scott A
Purchase Details
Closed on
Feb 1, 2016
Bought by
Hartland Homes Inc
Purchase Details
Closed on
May 14, 2004
Sold by
Burnett Donald O and Burnett Rose B
Bought by
Herbert James R and Herbert Cheri L
Create a Home Valuation Report for This Property
The Home Valuation Report is an in-depth analysis detailing your home's value as well as a comparison with similar homes in the area
Home Values in the Area
Average Home Value in this Area
Purchase History
| Date | Buyer | Sale Price | Title Company |
|---|---|---|---|
| Fletcher John James | $204,900 | All Performance Title Llc | |
| Hartland Homes Inc | $20,000 | Southeast Title Suncoast Inc | |
| Sanford Scott A | $2,500 | Southern Security Title Svcs | |
| Sanford Scott A | $2,500 | Southern Security Title Svcs | |
| Hartland Homes Inc | $100 | -- | |
| Herbert James R | $17,000 | Southern Security Title Serv |
Source: Public Records
Mortgage History
| Date | Status | Borrower | Loan Amount |
|---|---|---|---|
| Open | Fletcher John James | $151,900 |
Source: Public Records
Tax History Compared to Growth
Tax History
| Year | Tax Paid | Tax Assessment Tax Assessment Total Assessment is a certain percentage of the fair market value that is determined by local assessors to be the total taxable value of land and additions on the property. | Land | Improvement |
|---|---|---|---|---|
| 2024 | $2,622 | $169,581 | -- | -- |
| 2023 | $2,622 | $164,642 | $0 | $0 |
| 2022 | $2,529 | $159,847 | $0 | $0 |
| 2021 | $2,536 | $155,191 | $0 | $0 |
| 2020 | $2,389 | $153,048 | $0 | $0 |
| 2019 | $2,390 | $149,607 | $0 | $0 |
| 2018 | $144 | $9,400 | $9,400 | $0 |
| 2017 | $628 | $10,400 | $10,400 | $0 |
| 2016 | $205 | $8,200 | $0 | $0 |
| 2015 | $204 | $8,200 | $0 | $0 |
| 2014 | $202 | $8,200 | $0 | $0 |
Source: Public Records
Map
Nearby Homes
- 9135 Mazette Rd
- 0 Mazette Rd Unit 2252315
- 0 Mazette Rd Unit MFRW7870042
- 11344 Gallinule Ave
- 9116 Manetta Rd
- 9027 Mavis Rd
- 8405 Mazette Rd
- 0 Cockatoo Rd
- 9164 Bunting Rd
- 9170 Bunting Rd
- 11249 Fool Duck Ave
- 11362 Fool Duck Ave
- 9233 Quivira Rd
- 11288 Flower Ave
- 11336 Flower Ave
- 11112 Flatwood Ave
- 11137 Woodland Waters Blvd
- Lot 11 Godec Ct
- Lot 10 Godec Ct Ct
- 11035 Flatwood Ave
- 11258 Godwit Ave
- 11294 Godwit Ave
- 11273 Gyrafalcon Ave
- 0 0 Gyrafalcon Ave
- 11259 Godwit Ave
- 11285 Gyrafalcon Ave
- 11261 Gyrafalcon Ave
- 11297 Gyrafalcon Ave
- 11306 Godwit Ave
- 11295 Godwit
- 00 00 Gyrafalcon
- 9112 Mazette Rd
- 11332 Gyrafalcon Ave
- 00 Gyrafalcon Ave
- 11295 Godwit Ave
- 11309 Gyrafalcon Ave
- 11273 Gyrafalcon R H Bl
- 0 Godwit Ave
- 11282 Godwit Ave
- 11285 Gyra Falcon Ave