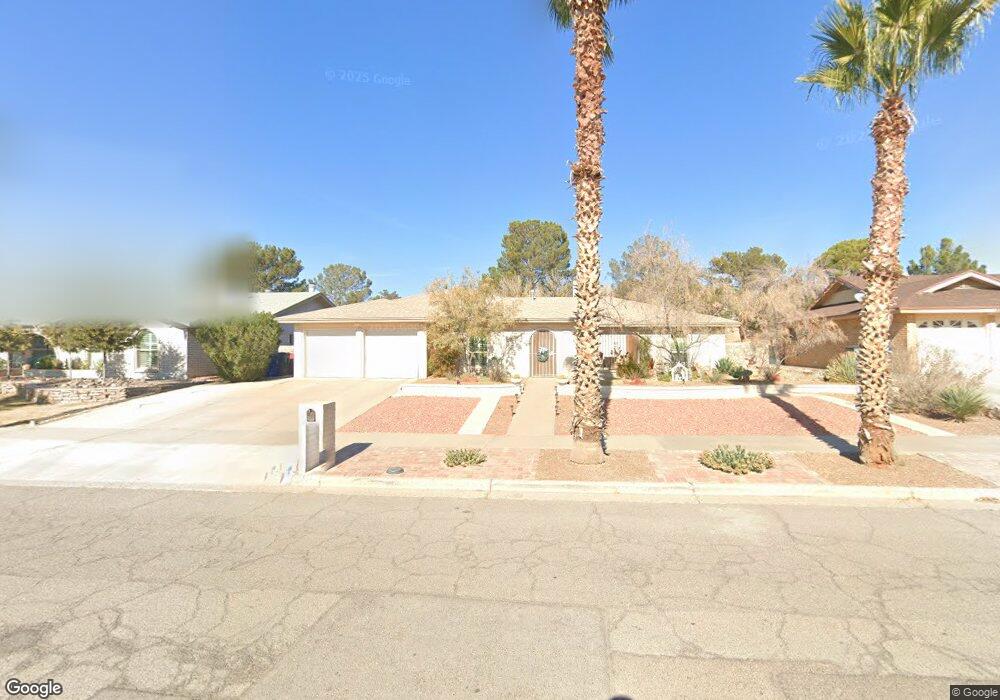
11271 Leo Collins Dr El Paso, TX 79936
Vista Hills NeighborhoodEstimated Value: $298,004 - $348,000
4
Beds
2
Baths
2,225
Sq Ft
$141/Sq Ft
Est. Value
About This Home
This home is located at 11271 Leo Collins Dr, El Paso, TX 79936 and is currently estimated at $314,501, approximately $141 per square foot. 11271 Leo Collins Dr is a home located in El Paso County with nearby schools including Tierra Del Sol Elementary School, J M Hanks High School, and EL PASO LEADERSHIP ACADEMY - MIDDLE EAST.
Ownership History
Date
Name
Owned For
Owner Type
Purchase Details
Closed on
Oct 13, 2017
Sold by
Bragg Crol
Bought by
Gillalnad Samuel E
Current Estimated Value
Home Financials for this Owner
Home Financials are based on the most recent Mortgage that was taken out on this home.
Original Mortgage
$102,500
Outstanding Balance
$55,699
Interest Rate
3.82%
Mortgage Type
Purchase Money Mortgage
Estimated Equity
$258,802
Purchase Details
Closed on
Feb 8, 2000
Sold by
Clark Mark E and Clark Nancy C
Bought by
Gilliland Samuel E and Gilliland Clarisa R
Purchase Details
Closed on
Jul 13, 1998
Sold by
Sedilla Larry M
Bought by
Clark Mark E and Clark Nancy C
Home Financials for this Owner
Home Financials are based on the most recent Mortgage that was taken out on this home.
Original Mortgage
$132,355
Interest Rate
7.05%
Mortgage Type
VA
Create a Home Valuation Report for This Property
The Home Valuation Report is an in-depth analysis detailing your home's value as well as a comparison with similar homes in the area
Home Values in the Area
Average Home Value in this Area
Purchase History
| Date | Buyer | Sale Price | Title Company |
|---|---|---|---|
| Gillalnad Samuel E | -- | None Available | |
| Gilliland Samuel E | -- | -- | |
| Clark Mark E | -- | Sierra Title |
Source: Public Records
Mortgage History
| Date | Status | Borrower | Loan Amount |
|---|---|---|---|
| Open | Gillalnad Samuel E | $102,500 | |
| Previous Owner | Clark Mark E | $132,355 | |
| Closed | Gilliland Samuel E | $0 |
Source: Public Records
Tax History Compared to Growth
Tax History
| Year | Tax Paid | Tax Assessment Tax Assessment Total Assessment is a certain percentage of the fair market value that is determined by local assessors to be the total taxable value of land and additions on the property. | Land | Improvement |
|---|---|---|---|---|
| 2025 | $4,523 | $308,624 | -- | -- |
| 2024 | $4,523 | $280,567 | $55,834 | $224,733 |
| 2023 | $4,523 | $280,567 | $55,834 | $224,733 |
| 2022 | $8,110 | $261,149 | $0 | $0 |
| 2021 | $7,717 | $260,019 | $55,834 | $204,185 |
| 2020 | $7,406 | $215,825 | $55,834 | $159,991 |
| 2018 | $7,740 | $248,905 | $55,834 | $193,071 |
| 2017 | $7,303 | $238,906 | $55,834 | $183,072 |
| 2016 | $7,303 | $238,906 | $55,834 | $183,072 |
| 2015 | $5,978 | $238,906 | $55,834 | $183,072 |
| 2014 | $5,978 | $240,995 | $55,834 | $185,161 |
Source: Public Records
Map
Nearby Homes
- 1664 Dick Ritter St
- 11262 Enid Wilson Ln
- 11268 Enid Wilson Ln
- 1607 Tommy Aaron Dr
- 1617 Tommy Aaron Dr
- 1628 Bert Green Dr
- 1624 Lou Graham Dr
- 11204 Bob Mitchell Dr
- 1703 Robert Wynn St
- 1605 Larry Wadkins Dr
- 1700 Jerry Abbott St
- 11157 Leo Collins Dr
- 11452 Jim Ferriell Dr
- 11470 Ed Merrins Dr
- 1739 Jerry Abbott St
- 3655 George Dieter Dr
- 1804 Jerry Abbott St
- 11531 Meadowbrook Dr
- 11506 James Grant Dr
- 1639 Brian Ray Cir
- 11267 Leo Collins Dr
- 11275 Leo Collins Dr
- 1673 Lou Graham St
- 11279 Leo Collins Dr
- 11263 Leo Collins Dr
- 1668 Dick Ritter Dr
- 1669 Lou Graham St
- 1664 Dick Ritter Dr
- 1672 Lou Graham St
- 11259 Leo Collins Dr
- 11283 Leo Collins Dr
- 1669 Dick Ritter Dr
- 1665 Lou Graham St
- 1668 Lou Graham St
- 1660 Dick Ritter Dr
- 1665 Dick Ritter Dr
- 1675 Bert Green Dr
- 11255 Leo Collins Dr
- 1668 Bob Smith Dr
- 11287 Leo Collins Dr