Estimated Value: $196,972 - $440,000
4
Beds
2
Baths
1,980
Sq Ft
$171/Sq Ft
Est. Value
About This Home
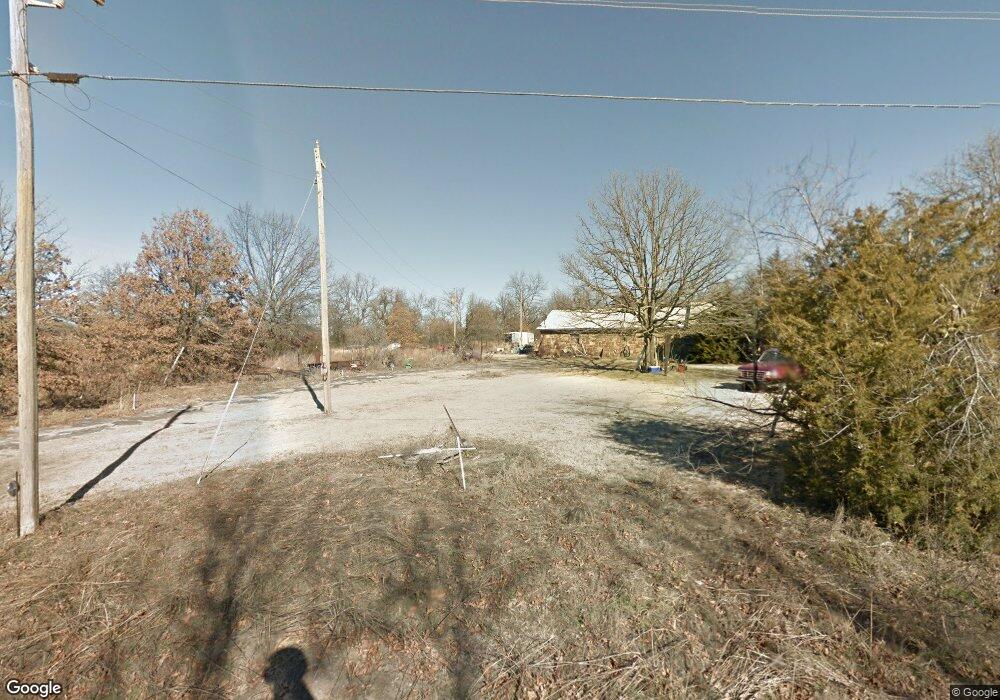
This home is located at 11275 E 264th St, Beggs, OK 74421 and is currently estimated at $338,993, approximately $171 per square foot. 11275 E 264th St is a home located in Okmulgee County with nearby schools including Beggs Elementary School, Beggs Middle School, and Beggs High School.
Create a Home Valuation Report for This Property
The Home Valuation Report is an in-depth analysis detailing your home's value as well as a comparison with similar homes in the area
Tax History
| Year | Tax Paid | Tax Assessment Tax Assessment Total Assessment is a certain percentage of the fair market value that is determined by local assessors to be the total taxable value of land and additions on the property. | Land | Improvement |
|---|---|---|---|---|
| 2025 | $1,212 | $13,060 | $2,374 | $10,686 |
| 2024 | $1,111 | $13,061 | $2,353 | $10,708 |
| 2023 | $1,070 | $12,311 | $2,258 | $10,053 |
| 2022 | $1,046 | $11,952 | $2,213 | $9,739 |
| 2021 | $1,045 | $11,952 | $2,213 | $9,739 |
| 2020 | $976 | $11,266 | $2,078 | $9,188 |
| 2019 | $940 | $10,938 | $1,956 | $8,982 |
| 2018 | $913 | $10,619 | $2,003 | $8,616 |
| 2017 | $830 | $10,310 | $2,202 | $8,108 |
| 2016 | $804 | $10,010 | $2,290 | $7,720 |
| 2015 | $819 | $9,718 | $2,229 | $7,489 |
| 2014 | $786 | $9,435 | $2,110 | $7,325 |
Source: Public Records
Map
Nearby Homes
- 16 260th St
- 14 260th St
- 080 260th St
- 4251 Norfolk Ave
- 5300 Highway 75
- 10 Little Rd
- 0 Mary Knox Dr
- 11319 Mary Knox Dr
- 11447 Mary Knox Dr
- 0 N 205th Rd Unit 2605607
- 00 N 205
- 15500 W Herrick
- 157 Hwy 16
- 0 Hwy 56 Unit 2606848
- 8468 Happy Camp Rd
- 000 Harreld Rd
- 4295 Happy Camp Rd
- 16130 Harper Ln
- 14221 Creager Rd
- 0 890 Rd Unit 2529008
- 11192 262nd St
- 11338 262nd St
- 11192 E 264th St
- 11451 E 264th St
- 11185 E 264th St
- 006 264th St
- 11392 E 264th St
- 11495 E 264th St
- 11104 E 264th St
- 11138 262nd St
- 11285 262nd St
- 11492 E 264th St
- 5440 Elwood Ln
- 11559 262nd St
- 11545 E 264th St
- 0 262nd St Unit 629929
- 0 262nd St Unit 1623208
- 0 262nd St Unit 1735952
- 0 262nd St Unit 2211741
- 0 268th St Unit 2021358
Your Personal Tour Guide
Ask me questions while you tour the home.