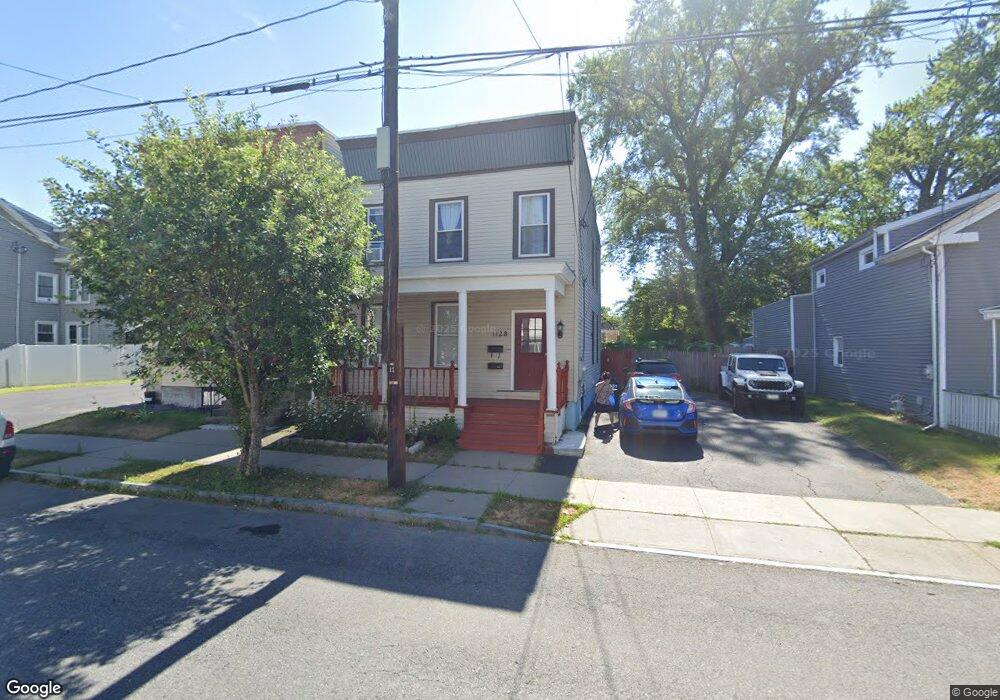
1128 3rd St Rensselaer, NY 12144
Estimated Value: $194,819 - $227,000
6
Beds
2
Baths
1,824
Sq Ft
$115/Sq Ft
Est. Value
About This Home
This home is located at 1128 3rd St, Rensselaer, NY 12144 and is currently estimated at $209,705, approximately $114 per square foot. 1128 3rd St is a home located in Rensselaer County with nearby schools including Van Rensselaer Elementary School, Rensselaer Junior/Senior High School, and KIPP Albany Community Charter Elementary School.
Ownership History
Date
Name
Owned For
Owner Type
Purchase Details
Closed on
Aug 18, 2023
Sold by
Sein Saw H
Bought by
Win San and Dah Eh M
Current Estimated Value
Home Financials for this Owner
Home Financials are based on the most recent Mortgage that was taken out on this home.
Original Mortgage
$100,000
Outstanding Balance
$97,784
Interest Rate
6.96%
Mortgage Type
Purchase Money Mortgage
Estimated Equity
$111,921
Purchase Details
Closed on
May 13, 2016
Sold by
Scott Jaime
Bought by
Sein Saw Hla
Home Financials for this Owner
Home Financials are based on the most recent Mortgage that was taken out on this home.
Original Mortgage
$140,900
Interest Rate
3.62%
Mortgage Type
FHA
Purchase Details
Closed on
Apr 15, 2005
Sold by
Slauson Richard and Slauson Leonard
Bought by
Scott James J
Create a Home Valuation Report for This Property
The Home Valuation Report is an in-depth analysis detailing your home's value as well as a comparison with similar homes in the area
Home Values in the Area
Average Home Value in this Area
Purchase History
| Date | Buyer | Sale Price | Title Company |
|---|---|---|---|
| Win San | $220,000 | None Available | |
| Sein Saw Hla | $143,500 | Thomas Gabriels | |
| Scott James J | $105,000 | Cindy Frinkona |
Source: Public Records
Mortgage History
| Date | Status | Borrower | Loan Amount |
|---|---|---|---|
| Open | Win San | $100,000 | |
| Previous Owner | Sein Saw Hla | $140,900 |
Source: Public Records
Tax History Compared to Growth
Tax History
| Year | Tax Paid | Tax Assessment Tax Assessment Total Assessment is a certain percentage of the fair market value that is determined by local assessors to be the total taxable value of land and additions on the property. | Land | Improvement |
|---|---|---|---|---|
| 2024 | $2,448 | $24,600 | $3,400 | $21,200 |
| 2023 | $2,372 | $24,600 | $3,400 | $21,200 |
| 2022 | $2,321 | $24,600 | $3,400 | $21,200 |
| 2021 | $631 | $24,600 | $3,400 | $21,200 |
| 2020 | $2,176 | $24,600 | $3,400 | $21,200 |
| 2019 | $2,113 | $24,600 | $3,400 | $21,200 |
| 2018 | $2,113 | $24,600 | $3,400 | $21,200 |
| 2017 | $1,481 | $24,600 | $3,400 | $21,200 |
Source: Public Records
Map
Nearby Homes