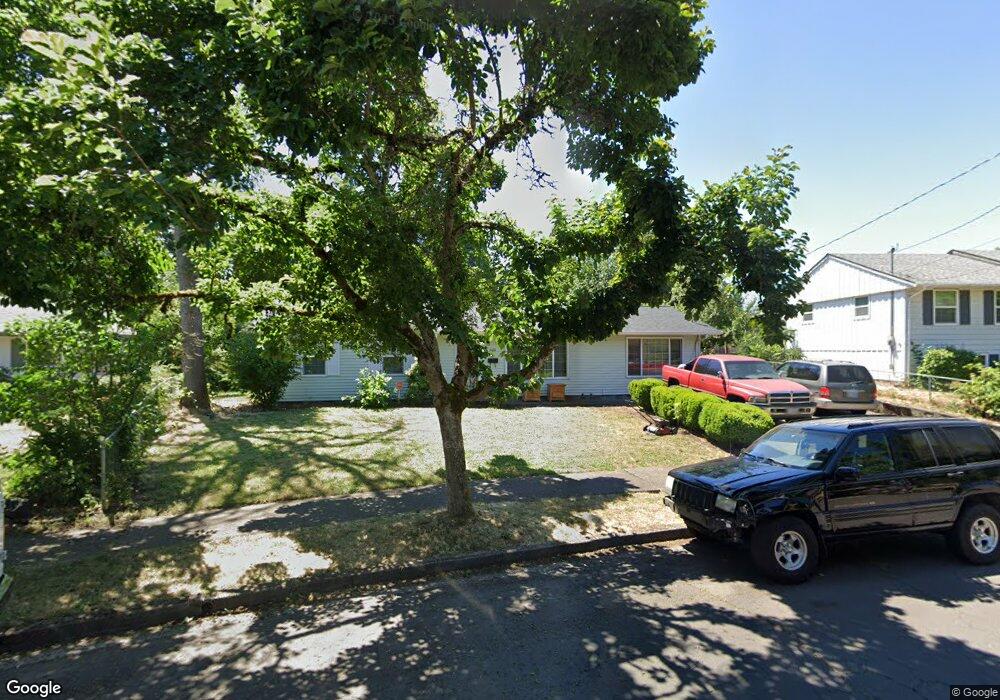
1128 Custom Way Springfield, OR 97477
Midtown South Springfield NeighborhoodEstimated Value: $329,000 - $364,000
3
Beds
1
Bath
1,144
Sq Ft
$302/Sq Ft
Est. Value
About This Home
This home is located at 1128 Custom Way, Springfield, OR 97477 and is currently estimated at $345,844, approximately $302 per square foot. 1128 Custom Way is a home located in Lane County with nearby schools including Two Rivers Dos Rios Elementary School, Hamlin Middle School, and Springfield High School.
Ownership History
Date
Name
Owned For
Owner Type
Purchase Details
Closed on
Oct 14, 2003
Sold by
Sprout Mary Carol
Bought by
Edlin Michael B and Edlin Donna F
Current Estimated Value
Home Financials for this Owner
Home Financials are based on the most recent Mortgage that was taken out on this home.
Original Mortgage
$88,400
Outstanding Balance
$41,459
Interest Rate
6.4%
Mortgage Type
Purchase Money Mortgage
Estimated Equity
$304,385
Purchase Details
Closed on
Sep 23, 2002
Sold by
Pearson Helen
Bought by
Pearson Helen and Helen Pearson Revocable Living Trust
Create a Home Valuation Report for This Property
The Home Valuation Report is an in-depth analysis detailing your home's value as well as a comparison with similar homes in the area
Home Values in the Area
Average Home Value in this Area
Purchase History
| Date | Buyer | Sale Price | Title Company |
|---|---|---|---|
| Edlin Michael B | $110,500 | Cascade Title Co | |
| Pearson Helen | -- | -- |
Source: Public Records
Mortgage History
| Date | Status | Borrower | Loan Amount |
|---|---|---|---|
| Open | Edlin Michael B | $88,400 |
Source: Public Records
Tax History
| Year | Tax Paid | Tax Assessment Tax Assessment Total Assessment is a certain percentage of the fair market value that is determined by local assessors to be the total taxable value of land and additions on the property. | Land | Improvement |
|---|---|---|---|---|
| 2025 | $2,913 | $158,839 | -- | -- |
| 2024 | $2,866 | $154,213 | -- | -- |
| 2023 | $2,866 | $149,722 | $0 | $0 |
| 2022 | $2,654 | $145,362 | $0 | $0 |
| 2021 | $2,606 | $141,129 | $0 | $0 |
| 2020 | $2,530 | $137,019 | $0 | $0 |
| 2019 | $2,454 | $133,029 | $0 | $0 |
| 2018 | $2,313 | $125,393 | $0 | $0 |
| 2017 | $2,225 | $125,393 | $0 | $0 |
| 2016 | $2,178 | $121,741 | $0 | $0 |
| 2015 | $2,116 | $118,195 | $0 | $0 |
| 2014 | $2,084 | $114,752 | $0 | $0 |
Source: Public Records
Map
Nearby Homes
Your Personal Tour Guide
Ask me questions while you tour the home.