Estimated Value: $89,000 - $141,000
3
Beds
2
Baths
1,403
Sq Ft
$88/Sq Ft
Est. Value
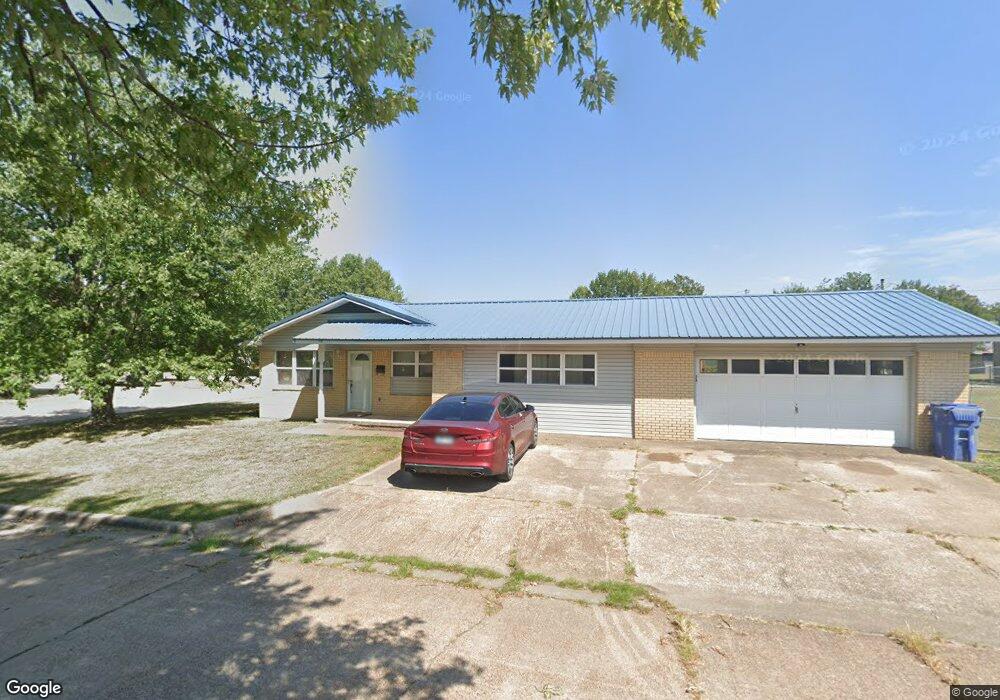
About This Home
This home is located at 1128 D St NE, Miami, OK 74354 and is currently estimated at $122,817, approximately $87 per square foot. 1128 D St NE is a home located in Ottawa County with nearby schools including Miami High School and Mt. Olive Lutheran School.
Ownership History
Date
Name
Owned For
Owner Type
Purchase Details
Closed on
Nov 3, 2025
Sold by
Ames Crystal
Bought by
Kunkel Real Estate Llc
Current Estimated Value
Home Financials for this Owner
Home Financials are based on the most recent Mortgage that was taken out on this home.
Original Mortgage
$101,718
Outstanding Balance
$101,428
Interest Rate
6.26%
Mortgage Type
New Conventional
Estimated Equity
$21,389
Purchase Details
Closed on
Oct 26, 2020
Sold by
Taylor Vanover
Purchase Details
Closed on
Jun 14, 2019
Bought by
Ames Crystal
Home Financials for this Owner
Home Financials are based on the most recent Mortgage that was taken out on this home.
Original Mortgage
$72,121
Interest Rate
4.1%
Mortgage Type
New Conventional
Purchase Details
Closed on
Aug 9, 2013
Home Financials for this Owner
Home Financials are based on the most recent Mortgage that was taken out on this home.
Original Mortgage
$85,048
Interest Rate
4.5%
Mortgage Type
FHA
Purchase Details
Closed on
Jun 4, 2007
Sold by
Arana Jennifer R
Purchase Details
Closed on
Nov 7, 2001
Create a Home Valuation Report for This Property
The Home Valuation Report is an in-depth analysis detailing your home's value as well as a comparison with similar homes in the area
Purchase History
| Date | Buyer | Sale Price | Title Company |
|---|---|---|---|
| Kunkel Real Estate Llc | $75,000 | Ottawa County Abstract & Title | |
| -- | -- | None Listed On Document | |
| Ames Crystal | $70,000 | Apex Title Northeast Ok Llc | |
| -- | -- | None Available | |
| -- | -- | None Available | |
| -- | $79,000 | -- |
Source: Public Records
Mortgage History
| Date | Status | Borrower | Loan Amount |
|---|---|---|---|
| Open | Kunkel Real Estate Llc | $101,718 | |
| Previous Owner | Ames Crystal | $72,121 | |
| Previous Owner | -- | $85,048 |
Source: Public Records
Tax History
| Year | Tax Paid | Tax Assessment Tax Assessment Total Assessment is a certain percentage of the fair market value that is determined by local assessors to be the total taxable value of land and additions on the property. | Land | Improvement |
|---|---|---|---|---|
| 2025 | $981 | $10,185 | $1,005 | $9,180 |
| 2024 | $935 | $9,700 | $957 | $8,743 |
| 2023 | $935 | $9,238 | $939 | $8,299 |
| 2022 | $813 | $8,798 | $918 | $7,880 |
| 2021 | $792 | $8,379 | $898 | $7,481 |
| 2020 | $760 | $7,980 | $879 | $7,101 |
| 2019 | $712 | $9,667 | $1,083 | $8,584 |
| 2018 | $695 | $9,412 | $1,083 | $8,329 |
| 2017 | $707 | $9,412 | $1,083 | $8,329 |
| 2016 | $694 | $9,634 | $1,080 | $8,554 |
| 2015 | $800 | $9,006 | $554 | $8,452 |
| 2014 | $684 | $9,353 | $1,140 | $8,213 |
Source: Public Records
Map
Nearby Homes
- 301 11th Ave NE
- 1421 Lucas Place
- 59608 Circle Dr
- 1525 N Main St
- 1209 B St NW
- 1024 Barger Place
- 1015 Quail Creek Dr
- TBD N Highway 69
- 1821 C St NE
- 1008 Quail Creek Dr
- 1400 12th Ave NE
- 1618 Camelot Place
- 1311 Park Heights St
- 1614 Camelot Place
- 1847 B St NE
- 1215 Sky Ln
- 425 Rockdale Blvd
- 302 F St NE
- 417 Coyne St
- 1916 C St NE
- 406 12th Ave NE
- 324 11th Place NE
- 1101 E St NW
- 1111 E St NE
- 410 12th Ave NE
- 325 12th Ave NE
- 315 11th Place NE
- 420 12th Ave NE
- 320 11th Place NE
- 316 11th Place NE
- 315 12th Ave NE
- 425 11th Ave NE
- 1200 E St NE
- 0 12th Ave NE
- 0 D St NE
- 415 11th Ave NE
- 312 11th Place NE
- 405 11th Ave NE
- 419 12th Ave NE
- 1206 D St NE
Your Personal Tour Guide
Ask me questions while you tour the home.