Estimated Value: $101,000 - $119,000
Studio
2
Baths
1,558
Sq Ft
$71/Sq Ft
Est. Value
About This Home
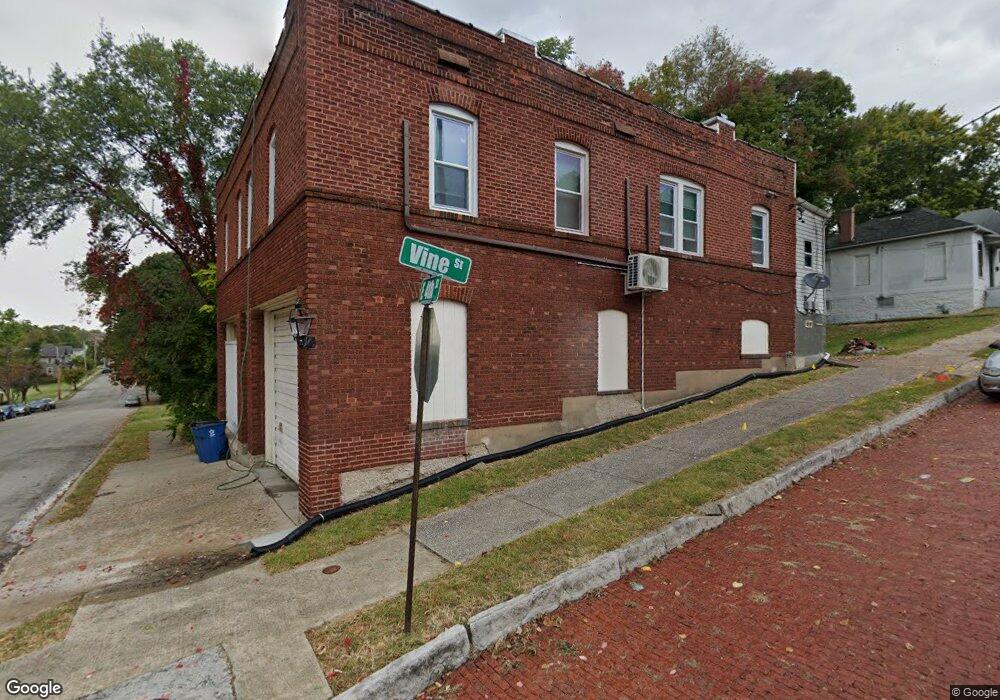
This home is located at 1128 E 4th St, Alton, IL 62002 and is currently estimated at $110,000, approximately $70 per square foot. 1128 E 4th St is a home located in Madison County with nearby schools including West Elementary School, Alton Middle School, and Alton High School.
Ownership History
Date
Name
Owned For
Owner Type
Purchase Details
Closed on
Apr 5, 2022
Sold by
Fencel Nicholas R
Bought by
Sun Nation Illinois Llc and Sun Nation Invil Llc
Current Estimated Value
Purchase Details
Closed on
Mar 30, 2022
Sold by
Fencel Nicholas R and Fencel Heather A
Bought by
Fencel Nicholas R
Purchase Details
Closed on
Jun 14, 2013
Sold by
Bentley Karen E and Bentley Frank A
Bought by
Fencel Nicholas R and Fencel Heather A
Home Financials for this Owner
Home Financials are based on the most recent Mortgage that was taken out on this home.
Original Mortgage
$29,389
Interest Rate
4.5%
Mortgage Type
Future Advance Clause Open End Mortgage
Create a Home Valuation Report for This Property
The Home Valuation Report is an in-depth analysis detailing your home's value as well as a comparison with similar homes in the area
Home Values in the Area
Average Home Value in this Area
Purchase History
| Date | Buyer | Sale Price | Title Company |
|---|---|---|---|
| Sun Nation Illinois Llc | $1,050,000 | Serenity Title & Escrow | |
| Fencel Nicholas R | -- | Serenity Title & Escrow | |
| Fencel Nicholas R | $57,000 | None Available |
Source: Public Records
Mortgage History
| Date | Status | Borrower | Loan Amount |
|---|---|---|---|
| Previous Owner | Fencel Nicholas R | $29,389 |
Source: Public Records
Tax History
| Year | Tax Paid | Tax Assessment Tax Assessment Total Assessment is a certain percentage of the fair market value that is determined by local assessors to be the total taxable value of land and additions on the property. | Land | Improvement |
|---|---|---|---|---|
| 2024 | $1,989 | $24,470 | $2,660 | $21,810 |
| 2023 | $1,989 | $22,100 | $2,400 | $19,700 |
| 2022 | $1,869 | $19,980 | $2,170 | $17,810 |
| 2021 | $1,720 | $18,780 | $2,040 | $16,740 |
| 2020 | $1,681 | $18,110 | $1,970 | $16,140 |
| 2019 | $1,738 | $17,700 | $1,930 | $15,770 |
| 2018 | $1,692 | $17,240 | $1,880 | $15,360 |
| 2017 | $1,668 | $17,240 | $1,880 | $15,360 |
| 2016 | $1,635 | $17,240 | $1,880 | $15,360 |
| 2015 | $1,553 | $17,240 | $1,880 | $15,360 |
| 2014 | $1,553 | $17,240 | $1,880 | $15,360 |
| 2013 | $1,553 | $17,710 | $1,930 | $15,780 |
Source: Public Records
Map
Nearby Homes
Your Personal Tour Guide
Ask me questions while you tour the home.