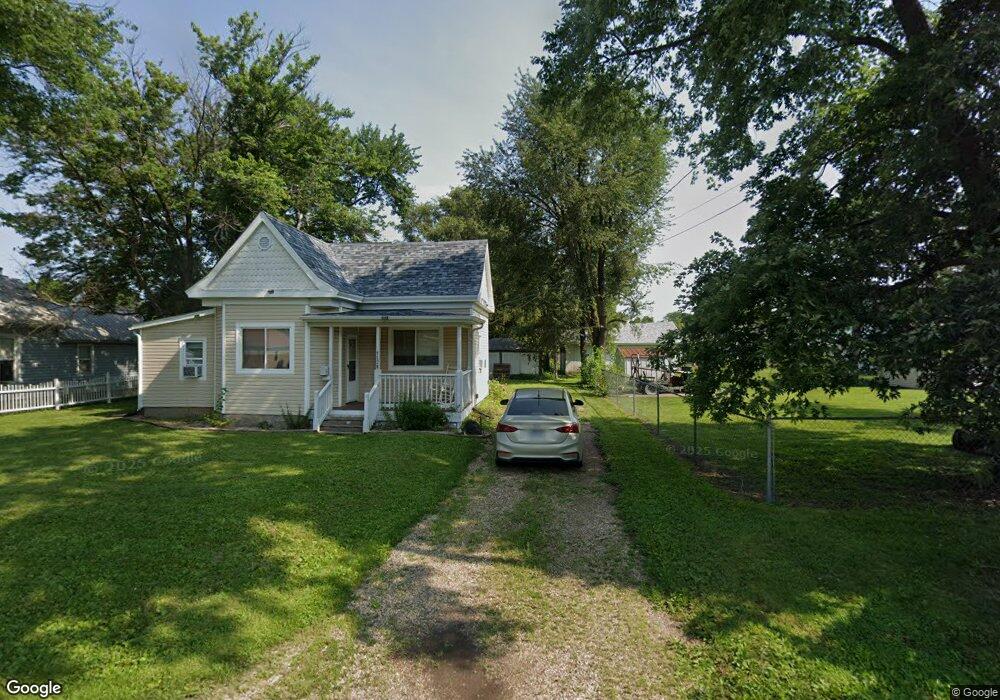
1128 E 5th Ave Monmouth, IL 61462
Estimated Value: $59,510 - $87,000
2
Beds
1
Bath
1,157
Sq Ft
$63/Sq Ft
Est. Value
About This Home
This home is located at 1128 E 5th Ave, Monmouth, IL 61462 and is currently estimated at $72,628, approximately $62 per square foot. 1128 E 5th Ave is a home with nearby schools including Lincoln Early Childhood School, Central Intermediate School, and Harding Primary School.
Ownership History
Date
Name
Owned For
Owner Type
Purchase Details
Closed on
Jul 13, 2021
Sold by
Midwest Bank Trust Department
Bought by
Cinzah Ukcung Thawng
Current Estimated Value
Home Financials for this Owner
Home Financials are based on the most recent Mortgage that was taken out on this home.
Original Mortgage
$31,000
Outstanding Balance
$19,175
Interest Rate
2.93%
Mortgage Type
New Conventional
Estimated Equity
$53,453
Purchase Details
Closed on
Aug 7, 2008
Sold by
Vanskike Dustin Shane
Bought by
Montroy James A
Create a Home Valuation Report for This Property
The Home Valuation Report is an in-depth analysis detailing your home's value as well as a comparison with similar homes in the area
Home Values in the Area
Average Home Value in this Area
Purchase History
| Date | Buyer | Sale Price | Title Company |
|---|---|---|---|
| Cinzah Ukcung Thawng | $40,000 | None Available | |
| Montroy James A | $5,500 | None Available |
Source: Public Records
Mortgage History
| Date | Status | Borrower | Loan Amount |
|---|---|---|---|
| Open | Cinzah Ukcung Thawng | $31,000 |
Source: Public Records
Tax History Compared to Growth
Tax History
| Year | Tax Paid | Tax Assessment Tax Assessment Total Assessment is a certain percentage of the fair market value that is determined by local assessors to be the total taxable value of land and additions on the property. | Land | Improvement |
|---|---|---|---|---|
| 2024 | $916 | $15,110 | $2,590 | $12,520 |
| 2023 | $916 | $14,170 | $2,430 | $11,740 |
| 2022 | $772 | $13,530 | $2,320 | $11,210 |
| 2021 | $286 | $6,840 | $2,170 | $4,670 |
| 2020 | $705 | $6,840 | $2,170 | $4,670 |
| 2019 | $680 | $6,660 | $2,110 | $4,550 |
| 2018 | $673 | $6,590 | $2,090 | $4,500 |
| 2017 | $660 | $6,560 | $2,080 | $4,480 |
| 2016 | $633 | $6,560 | $2,080 | $4,480 |
| 2015 | -- | $6,400 | $2,030 | $4,370 |
| 2014 | -- | $6,240 | $1,980 | $4,260 |
| 2013 | -- | $5,960 | $1,890 | $4,070 |
Source: Public Records
Map
Nearby Homes