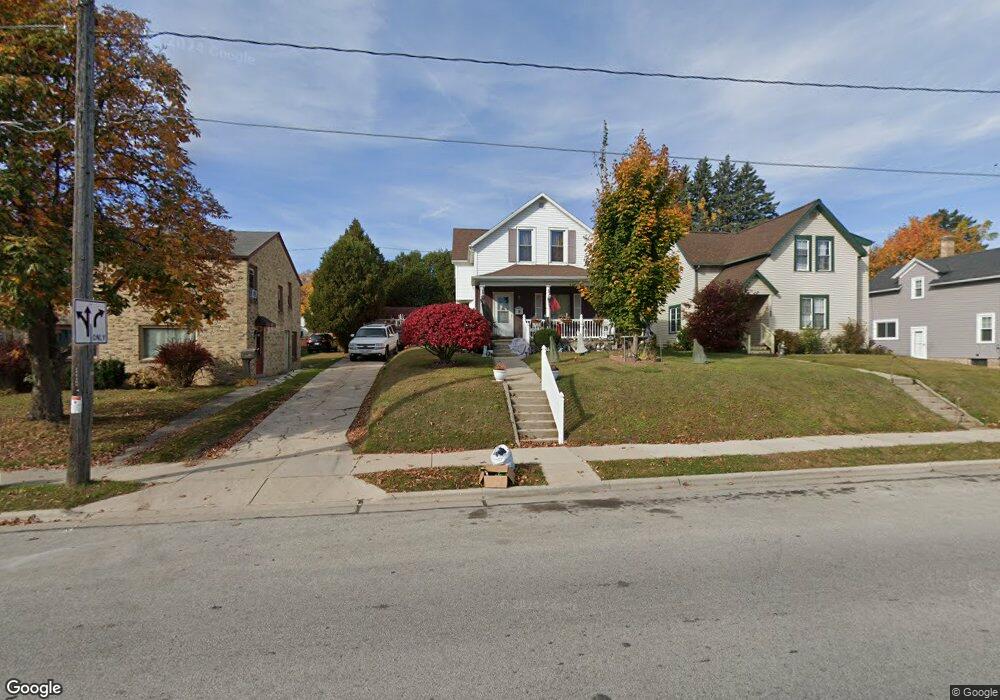
1128 N 8th St Manitowoc, WI 54220
Estimated Value: $200,000 - $219,000
3
Beds
2
Baths
728
Sq Ft
$291/Sq Ft
Est. Value
About This Home
This home is located at 1128 N 8th St, Manitowoc, WI 54220 and is currently estimated at $212,062, approximately $291 per square foot. 1128 N 8th St is a home located in Manitowoc County with nearby schools including Jackson Elementary School, Wilson Middle School, and Lincoln High School.
Ownership History
Date
Name
Owned For
Owner Type
Purchase Details
Closed on
Mar 22, 2010
Sold by
Federal Home Loan Mortgage Corporation
Bought by
Wordell Judith A
Current Estimated Value
Purchase Details
Closed on
Oct 20, 2009
Sold by
Townes David L
Bought by
Federal Home Loan Mortgage Corp
Purchase Details
Closed on
Nov 30, 2005
Sold by
Bb Improvement Co
Bought by
Townes David L
Create a Home Valuation Report for This Property
The Home Valuation Report is an in-depth analysis detailing your home's value as well as a comparison with similar homes in the area
Home Values in the Area
Average Home Value in this Area
Purchase History
| Date | Buyer | Sale Price | Title Company |
|---|---|---|---|
| Wordell Judith A | $62,000 | -- | |
| Federal Home Loan Mortgage Corp | $68,000 | -- | |
| Townes David L | $93,000 | None Available |
Source: Public Records
Mortgage History
| Date | Status | Borrower | Loan Amount |
|---|---|---|---|
| Closed | Townes David L | $0 |
Source: Public Records
Tax History Compared to Growth
Tax History
| Year | Tax Paid | Tax Assessment Tax Assessment Total Assessment is a certain percentage of the fair market value that is determined by local assessors to be the total taxable value of land and additions on the property. | Land | Improvement |
|---|---|---|---|---|
| 2024 | $2,451 | $141,400 | $19,500 | $121,900 |
| 2023 | $2,275 | $141,400 | $19,500 | $121,900 |
| 2022 | $2,100 | $102,600 | $19,500 | $83,100 |
| 2021 | $1,976 | $102,600 | $19,500 | $83,100 |
| 2020 | $1,403 | $68,500 | $19,500 | $49,000 |
| 2019 | $1,393 | $68,500 | $19,500 | $49,000 |
| 2018 | $1,361 | $68,500 | $19,500 | $49,000 |
| 2017 | $1,382 | $68,500 | $19,500 | $49,000 |
| 2016 | $1,438 | $68,500 | $19,500 | $49,000 |
| 2015 | $1,412 | $68,500 | $19,500 | $49,000 |
| 2014 | $1,377 | $68,500 | $19,500 | $49,000 |
| 2013 | $1,393 | $68,500 | $19,500 | $49,000 |
Source: Public Records
Map
Nearby Homes