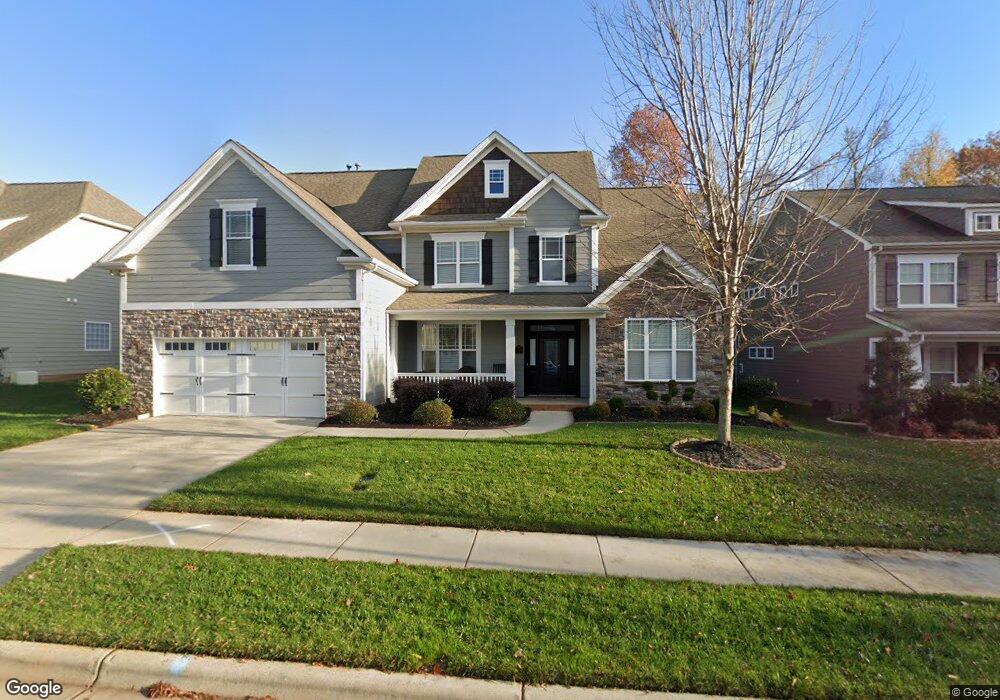
1128 Saratoga Blvd Indian Trail, NC 28079
Estimated Value: $571,104 - $636,000
6
Beds
4
Baths
3,601
Sq Ft
$168/Sq Ft
Est. Value
About This Home
This home is located at 1128 Saratoga Blvd, Indian Trail, NC 28079 and is currently estimated at $604,526, approximately $167 per square foot. 1128 Saratoga Blvd is a home located in Union County with nearby schools including Poplin Elementary School, Porter Ridge Middle School, and Porter Ridge High School.
Ownership History
Date
Name
Owned For
Owner Type
Purchase Details
Closed on
Sep 5, 2012
Sold by
Federal National Mortgage Association
Bought by
Dixon Stephanie and Dixon Corey
Current Estimated Value
Home Financials for this Owner
Home Financials are based on the most recent Mortgage that was taken out on this home.
Original Mortgage
$231,345
Outstanding Balance
$161,134
Interest Rate
3.71%
Mortgage Type
New Conventional
Estimated Equity
$443,392
Purchase Details
Closed on
Apr 27, 2012
Sold by
Croly Todd E and Croly Melissa
Bought by
Federal National Mortgage Association
Purchase Details
Closed on
Sep 25, 2008
Sold by
Bonterra Builders Llc
Bought by
Croly Todd E and Croly Melissa
Home Financials for this Owner
Home Financials are based on the most recent Mortgage that was taken out on this home.
Original Mortgage
$356,340
Interest Rate
5.75%
Mortgage Type
Unknown
Purchase Details
Closed on
Jun 9, 2008
Sold by
Poplin Development Group Inc
Bought by
Bonterra Builders Llc
Create a Home Valuation Report for This Property
The Home Valuation Report is an in-depth analysis detailing your home's value as well as a comparison with similar homes in the area
Home Values in the Area
Average Home Value in this Area
Purchase History
| Date | Buyer | Sale Price | Title Company |
|---|---|---|---|
| Dixon Stephanie | -- | None Available | |
| Federal National Mortgage Association | $403,674 | None Available | |
| Croly Todd E | $375,500 | None Available | |
| Bonterra Builders Llc | $68,500 | None Available |
Source: Public Records
Mortgage History
| Date | Status | Borrower | Loan Amount |
|---|---|---|---|
| Open | Dixon Stephanie | $231,345 | |
| Previous Owner | Croly Todd E | $356,340 |
Source: Public Records
Tax History Compared to Growth
Tax History
| Year | Tax Paid | Tax Assessment Tax Assessment Total Assessment is a certain percentage of the fair market value that is determined by local assessors to be the total taxable value of land and additions on the property. | Land | Improvement |
|---|---|---|---|---|
| 2024 | $3,136 | $374,100 | $65,000 | $309,100 |
| 2023 | $3,110 | $374,100 | $65,000 | $309,100 |
| 2022 | $3,110 | $374,100 | $65,000 | $309,100 |
| 2021 | $3,110 | $374,100 | $65,000 | $309,100 |
| 2020 | $3,053 | $311,000 | $53,000 | $258,000 |
| 2019 | $3,053 | $311,000 | $53,000 | $258,000 |
| 2018 | $2,425 | $311,000 | $53,000 | $258,000 |
| 2017 | $3,214 | $311,000 | $53,000 | $258,000 |
| 2016 | $3,152 | $311,000 | $53,000 | $258,000 |
| 2015 | $2,574 | $311,000 | $53,000 | $258,000 |
| 2014 | $2,359 | $330,220 | $55,000 | $275,220 |
Source: Public Records
Map
Nearby Homes
- 272 Briana Marie Way
- 1018 Equipoise Dr
- 261 Briana Marie Way
- 269 Briana Marie Way
- 0 Saratoga Blvd
- 1021 Hercules Dr
- 1305 Belmont Stakes Ave
- 1011 Phar Lap Dr
- 149 Briana Marie Way
- 1515 Saratoga Blvd
- 280 Portrait Way
- 267 Portrait Way
- 211 Aldendale Dr
- 405 Northgate Blvd
- 4003 Ladys Secret Dr
- 1018 Back Stretch Blvd
- 523 Sunharvest Ln
- 1036 Preakness Blvd
- 324 Basil Dr
- 507 Sunharvest Ln
- 1130 Saratoga Blvd
- 1130 Saratoga Blvd Unit 447
- 1126 Saratoga Blvd
- 1123 Saratoga Blvd
- 1024 Affirmed Dr
- 1124 Saratoga Blvd
- 1124 Saratoga Blvd Unit Lot 450
- 1121 Saratoga Blvd
- 1022 Affirmed Dr
- 1200 Saratoga Blvd
- 1202 Saratoga Blvd
- 1119 Saratoga Blvd
- 1119 Saratoga Blvd Unit 698
- 276 Briana Marie Way
- 1020 Affirmed Dr
- 1118 Saratoga Blvd
- 1025 Affirmed Dr
- 268 Briana Marie Way
- 1117 Saratoga Blvd Unit 967
- 1117 Saratoga Blvd