1128 Scott St Fairfield, CA 94533
Estimated Value: $390,000 - $559,551
About This Home
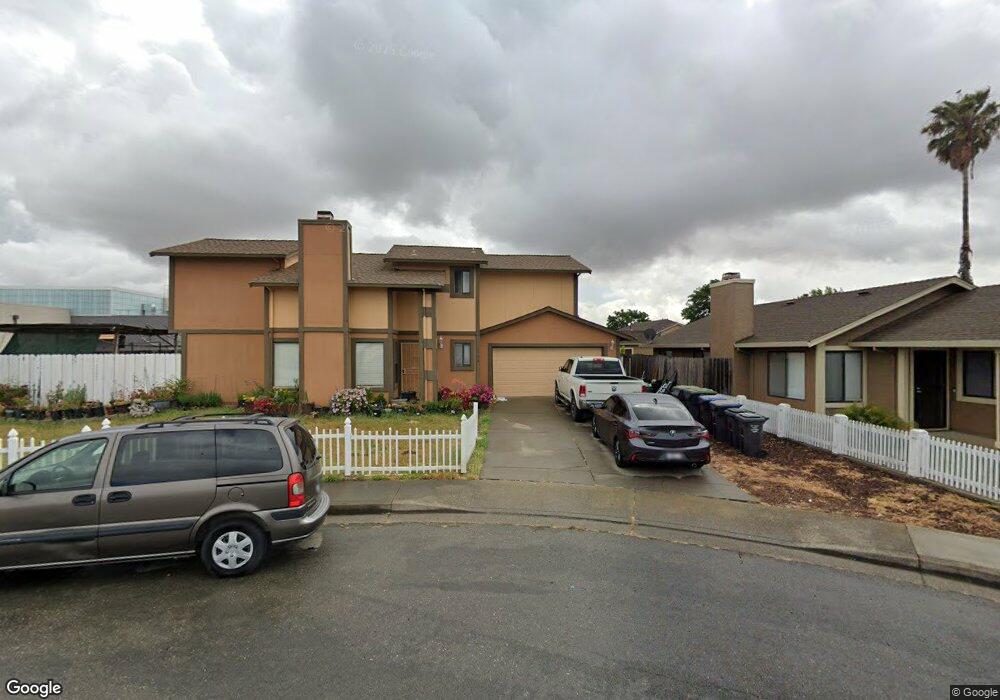
This home is located at 1128 Scott St, Fairfield, CA 94533 and is currently estimated at $500,638, approximately $309 per square foot. 1128 Scott St is a home located in Solano County with nearby schools including Cleo Gordon Elementary School, Grange Middle School, and Fairfield High School.
Ownership History
We collect this data history from publicly available records. To have your information removed, we recommend requesting removal directly through your county’s website.
Purchase Details
Home Financials for this Owner
Home Financials are based on the most recent Mortgage that was taken out on this home.Purchase Details
Purchase Details
Purchase Details
Purchase Details
Purchase Details
Home Financials for this Owner
Home Financials are based on the most recent Mortgage that was taken out on this home.Purchase Details
Purchase Details
Home Financials for this Owner
Home Financials are based on the most recent Mortgage that was taken out on this home.Purchase Details
Home Financials for this Owner
Home Financials are based on the most recent Mortgage that was taken out on this home.Purchase Details
Home Financials for this Owner
Home Financials are based on the most recent Mortgage that was taken out on this home.Purchase Details
Home Financials for this Owner
Home Financials are based on the most recent Mortgage that was taken out on this home.Purchase Details
Home Financials for this Owner
Home Financials are based on the most recent Mortgage that was taken out on this home.Purchase Details
Home Financials for this Owner
Home Financials are based on the most recent Mortgage that was taken out on this home.Purchase Details
Home Financials for this Owner
Home Financials are based on the most recent Mortgage that was taken out on this home.Purchase Details
Home Values in the Area
Average Home Value in this Area
Purchase History
We collect this data history from publicly available records. To have your information removed, we recommend requesting removal directly through your county’s website.
| Date | Buyer | Sale Price | Title Company |
|---|---|---|---|
| $368,000 | Placer Title Co | ||
| $105,500 | Landsafe Title | ||
| $146,700 | None Available | ||
| -- | First American Title Co | ||
| -- | -- | ||
| -- | Fidelity Title Co | ||
| -- | -- | ||
| $285,000 | North American Title Co | ||
| -- | North American Title Co | ||
| $121,000 | North American Title | ||
| -- | Chicago Title | ||
| -- | Fidelity National Title Co | ||
| -- | Fidelity National Title Co | ||
| $190,000 | Fidelity National Title Co | ||
| -- | Fidelity National Title Co | ||
| $127,500 | Frontier Title Company | ||
| -- | -- |
Mortgage History
We collect this data history from publicly available records. To have your information removed, we recommend requesting removal directly through your county’s website.
| Date | Status | Borrower | Loan Amount |
|---|---|---|---|
| Open | $338,500 | ||
| Previous Owner | $272,000 | ||
| Previous Owner | $228,000 | ||
| Previous Owner | $242,000 | ||
| Previous Owner | $95,000 | ||
| Previous Owner | $196,344 | ||
| Previous Owner | $130,050 | ||
| Closed | $42,750 |
Tax History
We collect this data history from publicly available records. To have your information removed, we recommend requesting removal directly through your county’s website.
| Year | Tax Paid | Tax Assessment Tax Assessment Total Assessment is a certain percentage of the fair market value that is determined by local assessors to be the total taxable value of land and additions on the property. | Land | Improvement |
|---|---|---|---|---|
| 2025 | $4,681 | $418,716 | $108,091 | $310,625 |
| 2024 | $4,681 | $410,507 | $105,972 | $304,535 |
| 2023 | $4,537 | $402,459 | $103,895 | $298,564 |
| 2022 | $4,482 | $394,568 | $101,858 | $292,710 |
| 2021 | $4,438 | $386,832 | $99,861 | $286,971 |
| 2020 | $4,334 | $382,867 | $98,838 | $284,029 |
| 2019 | $4,228 | $375,360 | $96,900 | $278,460 |
| 2018 | $1,315 | $116,015 | $44,153 | $71,862 |
| 2017 | $1,254 | $113,741 | $43,288 | $70,453 |
| 2016 | $1,235 | $111,512 | $42,440 | $69,072 |
| 2015 | $1,153 | $109,838 | $41,803 | $68,035 |
| 2014 | $1,141 | $107,688 | $40,985 | $66,703 |
Map
- 1850 Blossom Ave Unit 116
- 1850 Blossom Ave Unit 213
- 1850 Blossom Ave Unit 115
- 1718 Daniel Ct
- 1941 Grande Cir Unit 48
- 1061 Mockingbird Ct
- 854 Finch Way
- 1940 Grande Cir Unit 13
- 959 Matthew Ct
- 806 Finch Way
- 831 Meadowlark Dr
- 1910 Grande Cir Unit 115
- 86 Villa Cir
- 725 San Pedro St
- 523 Thomas Cir
- 521 Thomas Cir
- 1347 Lois Ln
- 806 Meadowlark Dr
- 513 San Remo St
- 536 San Dimas St
Ask me questions while you tour the home.