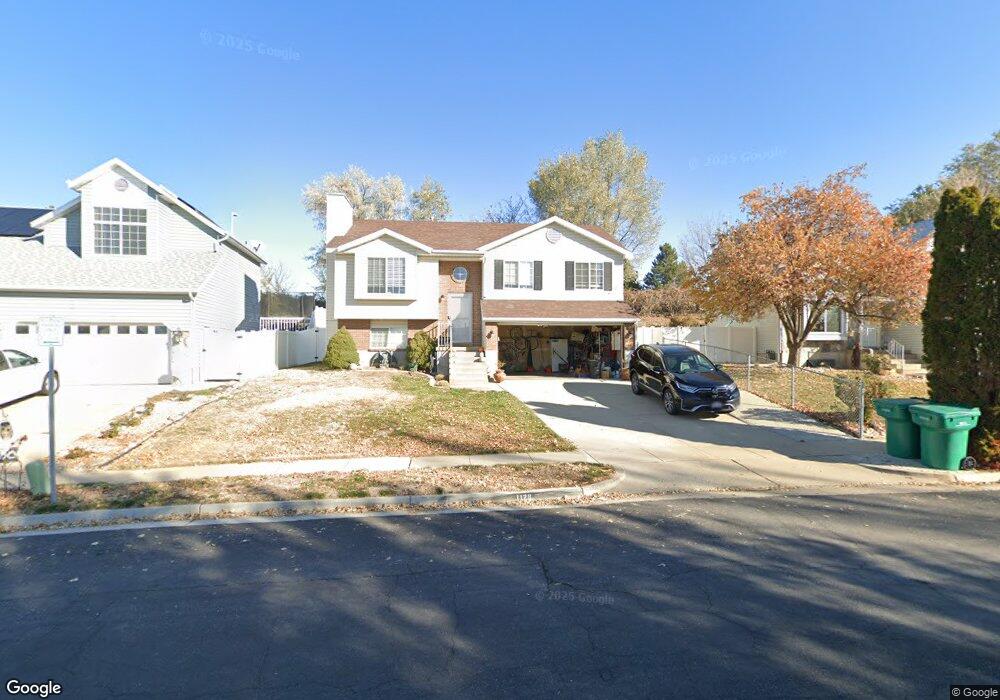
1128 W 2600 N Layton, UT 84041
Estimated Value: $427,626 - $454,000
4
Beds
1
Bath
1,750
Sq Ft
$250/Sq Ft
Est. Value
About This Home
This home is located at 1128 W 2600 N, Layton, UT 84041 and is currently estimated at $437,407, approximately $249 per square foot. 1128 W 2600 N is a home located in Davis County with nearby schools including Lincoln Elementary School, North Layton Junior High School, and Northridge High School.
Ownership History
Date
Name
Owned For
Owner Type
Purchase Details
Closed on
May 24, 2017
Sold by
Livingston Christy
Bought by
Livingston Trent
Current Estimated Value
Purchase Details
Closed on
Nov 16, 2011
Sold by
Mcgee Michael D
Bought by
Livingston Christy
Home Financials for this Owner
Home Financials are based on the most recent Mortgage that was taken out on this home.
Original Mortgage
$86,625
Outstanding Balance
$8,335
Interest Rate
3.22%
Mortgage Type
New Conventional
Estimated Equity
$429,072
Purchase Details
Closed on
Jun 25, 2007
Sold by
Phillips Robert L
Bought by
Mcgee Michael D
Home Financials for this Owner
Home Financials are based on the most recent Mortgage that was taken out on this home.
Original Mortgage
$159,792
Interest Rate
6.16%
Mortgage Type
FHA
Purchase Details
Closed on
Jun 24, 1997
Sold by
Hamilton Dawn A
Bought by
Phillips Robert L
Home Financials for this Owner
Home Financials are based on the most recent Mortgage that was taken out on this home.
Original Mortgage
$108,915
Interest Rate
7.04%
Mortgage Type
VA
Create a Home Valuation Report for This Property
The Home Valuation Report is an in-depth analysis detailing your home's value as well as a comparison with similar homes in the area
Home Values in the Area
Average Home Value in this Area
Purchase History
| Date | Buyer | Sale Price | Title Company |
|---|---|---|---|
| Livingston Trent | -- | -- | |
| Livingston Christy | -- | Mountain View Title | |
| Mcgee Michael D | -- | First American Title | |
| Phillips Robert L | -- | Home Abst & Title Co |
Source: Public Records
Mortgage History
| Date | Status | Borrower | Loan Amount |
|---|---|---|---|
| Open | Livingston Christy | $86,625 | |
| Previous Owner | Mcgee Michael D | $159,792 | |
| Previous Owner | Phillips Robert L | $108,915 |
Source: Public Records
Tax History Compared to Growth
Tax History
| Year | Tax Paid | Tax Assessment Tax Assessment Total Assessment is a certain percentage of the fair market value that is determined by local assessors to be the total taxable value of land and additions on the property. | Land | Improvement |
|---|---|---|---|---|
| 2024 | $1,846 | $195,249 | $102,610 | $92,639 |
| 2023 | $1,856 | $190,300 | $71,409 | $118,890 |
| 2022 | $1,907 | $351,000 | $120,499 | $230,501 |
| 2021 | $1,716 | $259,000 | $86,997 | $172,003 |
| 2020 | $1,540 | $223,000 | $75,671 | $147,329 |
| 2019 | $1,551 | $220,000 | $74,193 | $145,807 |
| 2018 | $1,384 | $197,000 | $74,193 | $122,807 |
| 2016 | $1,226 | $90,035 | $22,084 | $67,951 |
| 2015 | $1,166 | $81,345 | $22,084 | $59,261 |
| 2014 | $1,141 | $81,354 | $22,084 | $59,270 |
| 2013 | -- | $70,673 | $20,680 | $49,993 |
Source: Public Records
Map
Nearby Homes
- 2887 N 1175 W
- 2949 N 1175 W
- 2402 N 725 W
- 850 S 1650 E Unit D
- 2378 N 675 W
- 1548 E 925 S
- 709 W Highway 193
- 781 W 2150 N
- 2875 N Hill Field Rd Unit 58
- 2875 N Hill Field Rd Unit 17
- 2875 N Hill Field Rd Unit 62
- 2211 N 525 W
- 2248 N 500 W
- 2187 N 450 W
- 1606 W 1960 N
- 1208 Valhalla Dr
- 65 Sunset Dr
- 63 Sunset Dr
- 86 Atherton Way
- 1665 W 1960 N