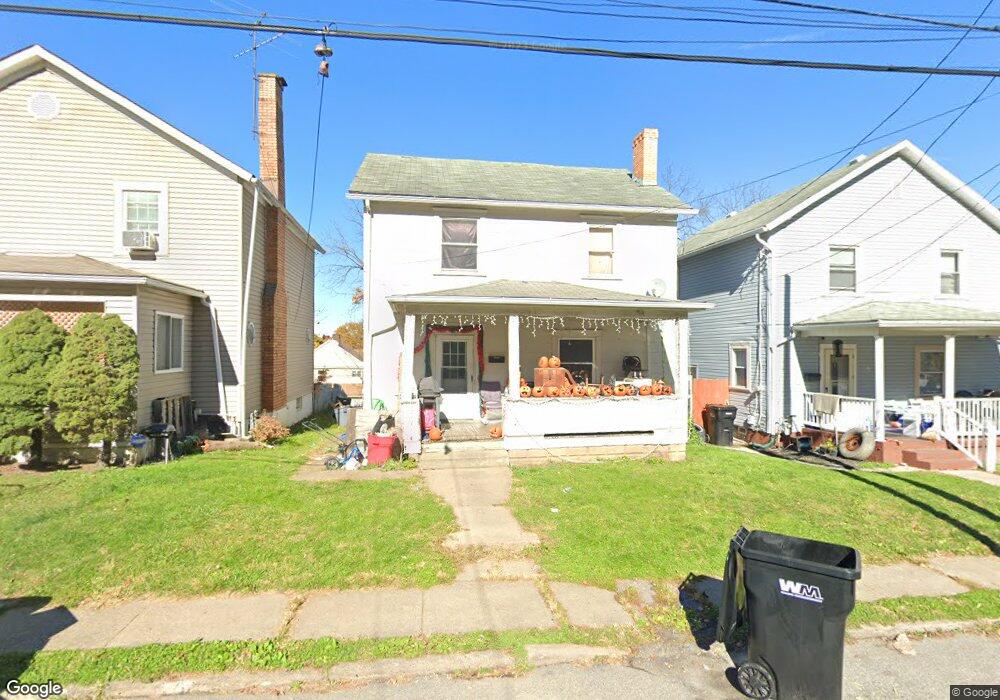
1128 Wade St Aliquippa, PA 15001
Estimated Value: $63,000 - $119,000
3
Beds
1
Bath
1,352
Sq Ft
$64/Sq Ft
Est. Value
About This Home
This home is located at 1128 Wade St, Aliquippa, PA 15001 and is currently estimated at $86,044, approximately $63 per square foot. 1128 Wade St is a home located in Beaver County with nearby schools including Aliquippa Elementary School, Aliquippa Junior/Senior High School, and Our Lady Of Fatima Elementary School.
Ownership History
Date
Name
Owned For
Owner Type
Purchase Details
Closed on
Jan 6, 2023
Sold by
Betters Jason
Bought by
Galdamez Marilin De Maria Per
Current Estimated Value
Purchase Details
Closed on
Dec 7, 2005
Sold by
Ketchel George A
Bought by
Betters Jason
Home Financials for this Owner
Home Financials are based on the most recent Mortgage that was taken out on this home.
Original Mortgage
$20,000
Interest Rate
6.33%
Mortgage Type
New Conventional
Create a Home Valuation Report for This Property
The Home Valuation Report is an in-depth analysis detailing your home's value as well as a comparison with similar homes in the area
Home Values in the Area
Average Home Value in this Area
Purchase History
| Date | Buyer | Sale Price | Title Company |
|---|---|---|---|
| Galdamez Marilin De Maria Per | $27,500 | Heritage Security & Service | |
| Betters Jason | $25,000 | -- |
Source: Public Records
Mortgage History
| Date | Status | Borrower | Loan Amount |
|---|---|---|---|
| Previous Owner | Betters Jason | $20,000 |
Source: Public Records
Tax History Compared to Growth
Tax History
| Year | Tax Paid | Tax Assessment Tax Assessment Total Assessment is a certain percentage of the fair market value that is determined by local assessors to be the total taxable value of land and additions on the property. | Land | Improvement |
|---|---|---|---|---|
| 2025 | $258 | $35,200 | $6,450 | $28,750 |
| 2024 | $1,603 | $35,200 | $6,450 | $28,750 |
| 2023 | $2,150 | $15,200 | $2,950 | $12,250 |
| 2022 | $2,105 | $15,200 | $2,950 | $12,250 |
| 2021 | $2,105 | $15,200 | $2,950 | $12,250 |
| 2020 | $2,054 | $15,200 | $2,950 | $12,250 |
| 2019 | $395 | $15,200 | $2,950 | $12,250 |
| 2018 | $1,973 | $15,200 | $2,950 | $12,250 |
| 2017 | $1,382 | $15,200 | $2,950 | $12,250 |
| 2016 | $1,848 | $15,200 | $2,950 | $12,250 |
| 2015 | $337 | $15,200 | $2,950 | $12,250 |
| 2014 | $337 | $15,200 | $2,950 | $12,250 |
Source: Public Records
Map
Nearby Homes