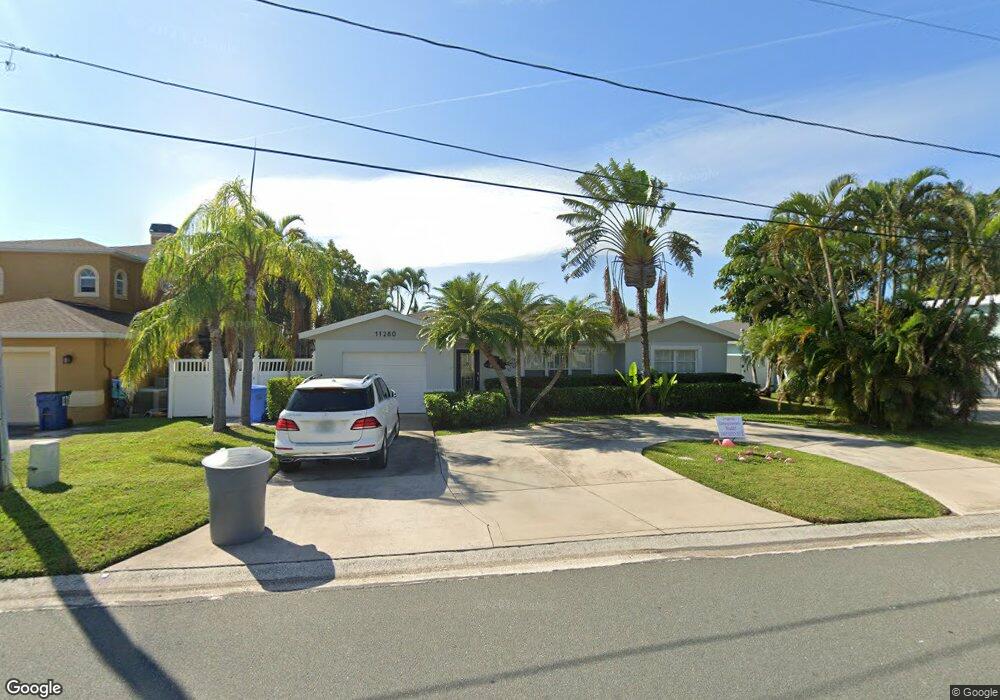
11280 5th St E Treasure Island, FL 33706
Estimated Value: $972,259 - $1,422,000
3
Beds
3
Baths
2,242
Sq Ft
$512/Sq Ft
Est. Value
About This Home
This home is located at 11280 5th St E, Treasure Island, FL 33706 and is currently estimated at $1,148,565, approximately $512 per square foot. 11280 5th St E is a home located in Pinellas County with nearby schools including Azalea Elementary School, Azalea Middle School, and Boca Ciega High School.
Ownership History
Date
Name
Owned For
Owner Type
Purchase Details
Closed on
Jan 21, 2025
Sold by
Rabaut Ingrid M
Bought by
Rabaut Ingrid M and Ingrid M Rabaut Revocable Living Trust
Current Estimated Value
Purchase Details
Closed on
Mar 1, 2016
Sold by
Turner Tina M
Bought by
Rabaut Ingrid
Purchase Details
Closed on
Apr 27, 1995
Sold by
Skibo Hartley V and Skibo Donna B
Bought by
Turner James M and Turner Tina M
Purchase Details
Closed on
Nov 30, 1993
Sold by
Barnett Banks Tr Co N A
Bought by
Skibo Hartley and Skibo Donna B
Create a Home Valuation Report for This Property
The Home Valuation Report is an in-depth analysis detailing your home's value as well as a comparison with similar homes in the area
Home Values in the Area
Average Home Value in this Area
Purchase History
| Date | Buyer | Sale Price | Title Company |
|---|---|---|---|
| Rabaut Ingrid M | $100 | None Listed On Document | |
| Rabaut Ingrid M | $100 | None Listed On Document | |
| Rabaut Ingrid | $719,000 | Sea Star Title Company Llc | |
| Turner James M | $189,900 | -- | |
| Skibo Hartley | $120,100 | -- |
Source: Public Records
Tax History Compared to Growth
Tax History
| Year | Tax Paid | Tax Assessment Tax Assessment Total Assessment is a certain percentage of the fair market value that is determined by local assessors to be the total taxable value of land and additions on the property. | Land | Improvement |
|---|---|---|---|---|
| 2024 | $2,503 | $223,655 | -- | -- |
| 2023 | $2,503 | $193,079 | $0 | $0 |
| 2022 | $2,427 | $187,455 | $0 | $0 |
| 2021 | $2,459 | $181,995 | $0 | $0 |
| 2020 | $2,453 | $181,013 | $0 | $0 |
| 2019 | $2,407 | $176,943 | $0 | $0 |
| 2018 | $2,350 | $173,644 | $0 | $0 |
| 2017 | $2,318 | $170,072 | $0 | $0 |
| 2016 | $10,393 | $572,500 | $0 | $0 |
| 2015 | $4,669 | $290,274 | $0 | $0 |
| 2014 | $4,649 | $287,970 | $0 | $0 |
Source: Public Records
Map
Nearby Homes