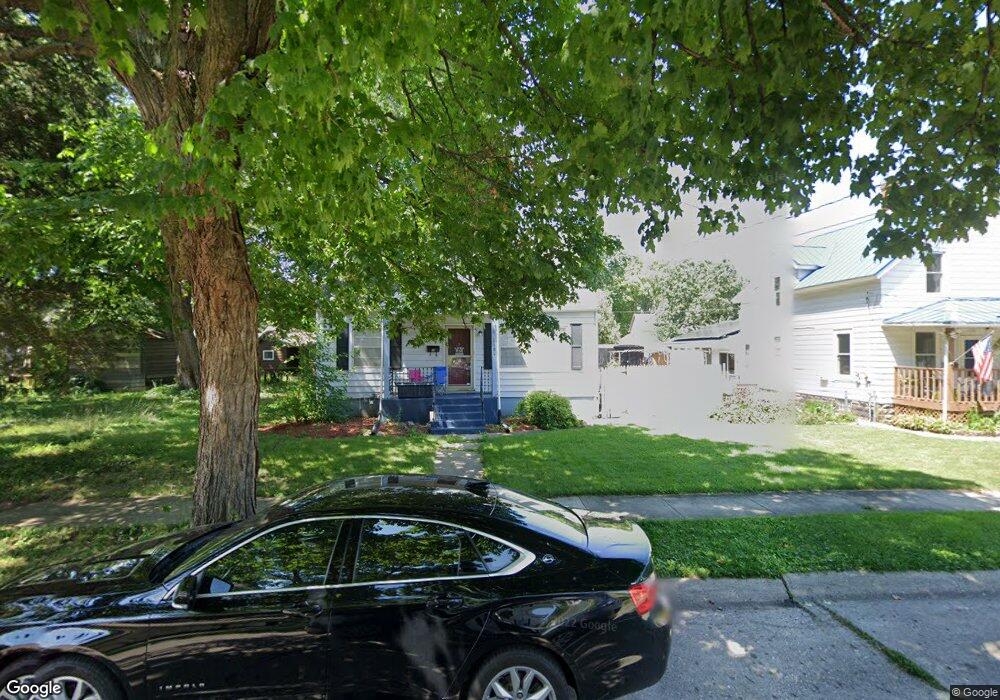
1129 15th St Rockford, IL 61104
Keith Creek NeighborhoodEstimated Value: $80,000 - $103,000
3
Beds
1
Bath
1,092
Sq Ft
$88/Sq Ft
Est. Value
About This Home
This home is located at 1129 15th St, Rockford, IL 61104 and is currently estimated at $95,612, approximately $87 per square foot. 1129 15th St is a home located in Winnebago County with nearby schools including Constance Lane Elementary School, Abraham Lincoln Middle School, and Rockford East High School.
Ownership History
Date
Name
Owned For
Owner Type
Purchase Details
Closed on
Jun 16, 2020
Sold by
Patton Rentals Inc
Bought by
Ronning Alex Anthony
Current Estimated Value
Purchase Details
Closed on
May 24, 2019
Sold by
Golden Trends Llc
Bought by
Golden Trends Llc and Patton Rentals Inc
Purchase Details
Closed on
Apr 11, 2018
Sold by
Residential Funding Co Llc
Bought by
Golden Trends Llc
Purchase Details
Closed on
May 20, 2009
Bought by
Patton Jeffrey
Create a Home Valuation Report for This Property
The Home Valuation Report is an in-depth analysis detailing your home's value as well as a comparison with similar homes in the area
Home Values in the Area
Average Home Value in this Area
Purchase History
| Date | Buyer | Sale Price | Title Company |
|---|---|---|---|
| Ronning Alex Anthony | $16,000 | Goldberg Cary | |
| Ronning Alex Anthony | $16,000 | None Listed On Document | |
| Golden Trends Llc | -- | None Listed On Document | |
| Golden Trends Llc | -- | Title Underwriters Agency | |
| Golden Trends Llc | -- | Title Underwriters Agency | |
| Golden Trends Llc | $4,500 | Meyer & Horning Pc | |
| Patton Jeffrey | $39,000 | -- |
Source: Public Records
Tax History Compared to Growth
Tax History
| Year | Tax Paid | Tax Assessment Tax Assessment Total Assessment is a certain percentage of the fair market value that is determined by local assessors to be the total taxable value of land and additions on the property. | Land | Improvement |
|---|---|---|---|---|
| 2024 | $2,130 | $22,477 | $5,167 | $17,310 |
| 2023 | $1,435 | $19,819 | $4,556 | $15,263 |
| 2022 | $1,843 | $16,133 | $4,072 | $12,061 |
| 2021 | $1,813 | $14,793 | $3,734 | $11,059 |
| 2020 | $1,597 | $12,420 | $3,531 | $8,889 |
| 2019 | $1,586 | $11,837 | $3,365 | $8,472 |
| 2018 | $1,400 | $12,209 | $3,171 | $9,038 |
| 2017 | $1,734 | $11,685 | $3,035 | $8,650 |
| 2016 | $1,045 | $12,292 | $2,978 | $9,314 |
| 2015 | $1,058 | $12,292 | $2,978 | $9,314 |
| 2014 | $1,547 | $10,402 | $3,730 | $6,672 |
Source: Public Records
Map
Nearby Homes