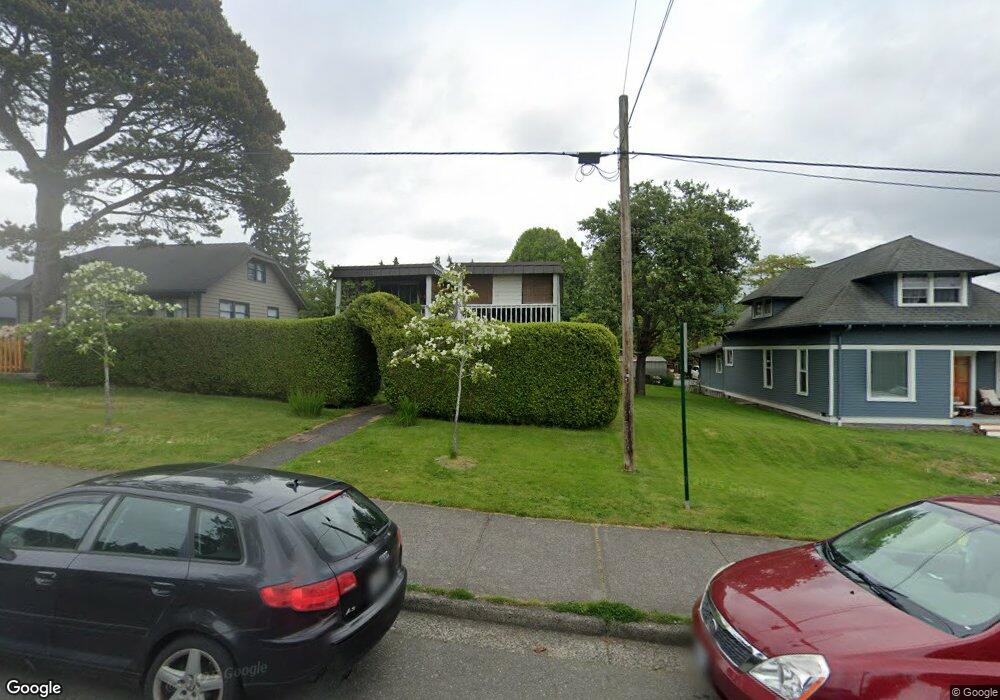
1129 21st St Bellingham, WA 98225
Happy Valley NeighborhoodEstimated Value: $791,000 - $918,000
4
Beds
4
Baths
2,240
Sq Ft
$376/Sq Ft
Est. Value
About This Home
This home is located at 1129 21st St, Bellingham, WA 98225 and is currently estimated at $842,333, approximately $376 per square foot. 1129 21st St is a home with nearby schools including Happy Valley Elementary School, Fairhaven Middle School, and Sehome High School.
Ownership History
Date
Name
Owned For
Owner Type
Purchase Details
Closed on
Jan 26, 1999
Sold by
The Colley Family Ltd Partnership
Bought by
Terhorst James S and Terhorst Pamela A
Current Estimated Value
Home Financials for this Owner
Home Financials are based on the most recent Mortgage that was taken out on this home.
Original Mortgage
$89,000
Outstanding Balance
$20,867
Interest Rate
6.63%
Mortgage Type
Commercial
Estimated Equity
$821,466
Create a Home Valuation Report for This Property
The Home Valuation Report is an in-depth analysis detailing your home's value as well as a comparison with similar homes in the area
Home Values in the Area
Average Home Value in this Area
Purchase History
| Date | Buyer | Sale Price | Title Company |
|---|---|---|---|
| Terhorst James S | $159,000 | Chicago Title Insurance Co |
Source: Public Records
Mortgage History
| Date | Status | Borrower | Loan Amount |
|---|---|---|---|
| Open | Terhorst James S | $89,000 |
Source: Public Records
Tax History Compared to Growth
Tax History
| Year | Tax Paid | Tax Assessment Tax Assessment Total Assessment is a certain percentage of the fair market value that is determined by local assessors to be the total taxable value of land and additions on the property. | Land | Improvement |
|---|---|---|---|---|
| 2024 | $6,600 | $818,903 | $422,350 | $396,553 |
| 2023 | $6,600 | $848,181 | $437,450 | $410,731 |
| 2022 | $5,434 | $721,860 | $372,300 | $349,560 |
| 2021 | $5,163 | $582,161 | $300,250 | $281,911 |
| 2020 | $5,073 | $510,663 | $263,375 | $247,288 |
| 2019 | $3,984 | $484,730 | $250,000 | $234,730 |
| 2018 | $4,120 | $381,745 | $169,260 | $212,485 |
| 2017 | $3,634 | $338,852 | $150,240 | $188,612 |
| 2016 | $3,308 | $312,024 | $138,240 | $173,784 |
| 2015 | $3,256 | $295,927 | $131,040 | $164,887 |
| 2014 | -- | $281,829 | $124,800 | $157,029 |
| 2013 | -- | $268,280 | $120,000 | $148,280 |
Source: Public Records
Map
Nearby Homes
- 1121 22nd St
- 1208 23rd St
- 1306 23rd St
- 1019 Lenora Ct
- 926 24th St
- 923 24th St
- 2400 Donovan Ave Unit 13
- 1605 Donovan Ave
- 1005 15th St
- 1315 Mill Ave
- 2100 Lindsay Ave
- 1302 Larrabee Ave
- 2015 24th St Unit 101
- 2015 24th St Unit 31
- 706 16th St Unit A&B
- 917 13th St
- 1212 Old Fairhaven Pkwy Unit D202
- 1100 12th St
- 903 13th St
- 3104 Wilson Ave