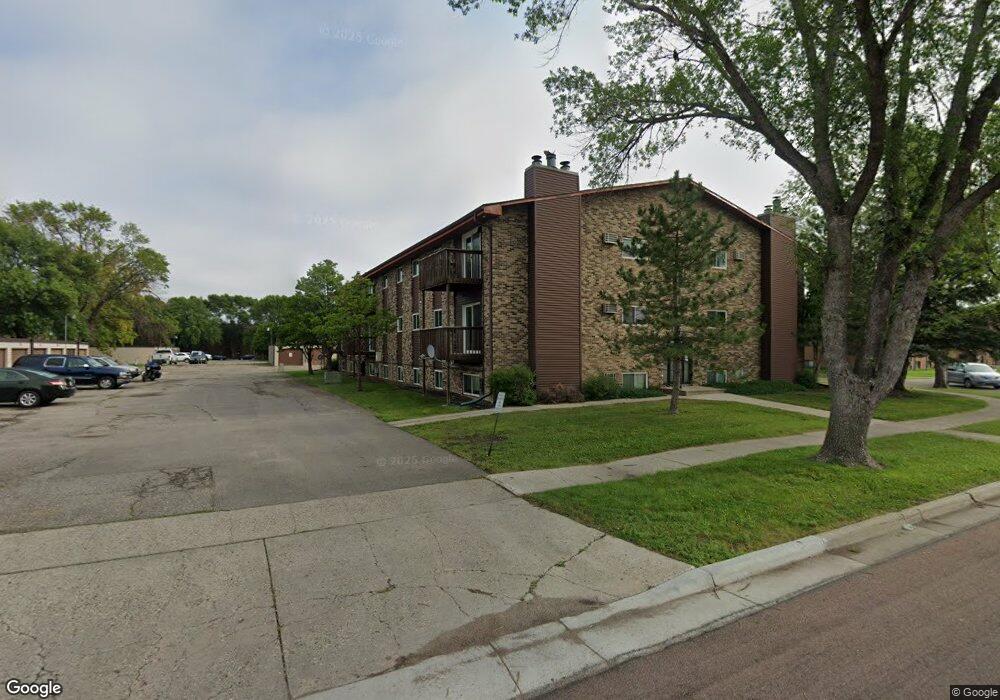
1129 22nd St S Unit B14 Fargo, ND 58103
Jefferson-Carl NeighborhoodEstimated Value: $88,000 - $118,730
2
Beds
1
Bath
967
Sq Ft
$112/Sq Ft
Est. Value
About This Home
This home is located at 1129 22nd St S Unit B14, Fargo, ND 58103 and is currently estimated at $108,183, approximately $111 per square foot. 1129 22nd St S Unit B14 is a home located in Cass County with nearby schools including Jefferson Elementary School, Carl Ben Eielson Middle School, and South High School.
Ownership History
Date
Name
Owned For
Owner Type
Purchase Details
Closed on
May 3, 2024
Sold by
Midland Ira Inc and Elizabeth Maring 1635884
Bought by
Ahmadzai Dilawar and Ahmadzai Bibi Amenda
Current Estimated Value
Purchase Details
Closed on
Jul 10, 2015
Sold by
Ista Eric R and Ista Jennifer
Bought by
Midland Ira Inc
Home Financials for this Owner
Home Financials are based on the most recent Mortgage that was taken out on this home.
Original Mortgage
$40,500
Interest Rate
4.05%
Mortgage Type
Future Advance Clause Open End Mortgage
Purchase Details
Closed on
Jan 20, 2010
Sold by
Tryhus Richard O
Bought by
Ista Eric R
Home Financials for this Owner
Home Financials are based on the most recent Mortgage that was taken out on this home.
Original Mortgage
$51,360
Interest Rate
5.02%
Mortgage Type
New Conventional
Create a Home Valuation Report for This Property
The Home Valuation Report is an in-depth analysis detailing your home's value as well as a comparison with similar homes in the area
Home Values in the Area
Average Home Value in this Area
Purchase History
| Date | Buyer | Sale Price | Title Company |
|---|---|---|---|
| Ahmadzai Dilawar | $93,000 | Title Company-Residential | |
| Midland Ira Inc | $84,000 | Title Co | |
| Ista Eric R | $64,200 | -- |
Source: Public Records
Mortgage History
| Date | Status | Borrower | Loan Amount |
|---|---|---|---|
| Previous Owner | Midland Ira Inc | $40,500 | |
| Previous Owner | Ista Eric R | $51,360 |
Source: Public Records
Tax History Compared to Growth
Tax History
| Year | Tax Paid | Tax Assessment Tax Assessment Total Assessment is a certain percentage of the fair market value that is determined by local assessors to be the total taxable value of land and additions on the property. | Land | Improvement |
|---|---|---|---|---|
| 2024 | $1,208 | $43,800 | $4,900 | $38,900 |
| 2023 | $1,095 | $39,800 | $4,900 | $34,900 |
| 2022 | $1,050 | $37,550 | $4,900 | $32,650 |
| 2021 | $966 | $35,100 | $4,900 | $30,200 |
| 2020 | $954 | $35,100 | $4,900 | $30,200 |
| 2019 | $1,027 | $37,500 | $2,900 | $34,600 |
| 2018 | $1,005 | $37,500 | $2,900 | $34,600 |
| 2017 | $966 | $36,400 | $2,900 | $33,500 |
| 2016 | $877 | $36,400 | $2,900 | $33,500 |
| 2015 | $844 | $32,800 | $2,000 | $30,800 |
| 2014 | $787 | $29,800 | $2,000 | $27,800 |
| 2013 | $783 | $29,800 | $2,000 | $27,800 |
Source: Public Records
Map
Nearby Homes
- 1129 22nd St S Unit B09
- 1129 22nd St S Unit B12
- 2013 13th Ave S
- 814 19th St S
- 813 17th St S
- 2209 6th Ave S
- 1301 16 1 2 St S
- 1407 17th St S
- 2202 15th Ave S
- 2126 5th Ave S
- 1402 E Gateway Cir S Unit M
- 2402 N Flickertail Dr S Unit 1
- 2213 5th Ave S
- 402 23rd St S
- 1418 11th Ave S
- 1418 12th Ave S
- 1524 5th Ave S
- 1414 10th Ave S
- 2867 Westgate Dr S
- 1410 14 1 2 St S
- 1129 22nd St S Unit 15
- 1129 22nd St S Unit B13
- 1129 22nd St S Unit B11
- 1129 22nd St S Unit B07
- 1129 22nd St S Unit B18
- 1129 22nd St S Unit B17
- 1129 22nd St S Unit B16
- 1129 22nd St S Unit B10
- 1129 22nd St S Unit B08
- 1129 22nd St S Unit B06
- 1129 22nd St S Unit B05
- 1129 22nd St S Unit B03
- 1129 22nd St S Unit B02
- 1129 22nd St S Unit B01
- 1129 22nd St S Unit B-6
- 1129 22nd St S
- 1129 22nd St S Unit B4
- 1129 22nd St S Unit B3
- 1129 22nd St S Unit B 17
- 1129 22nd St S