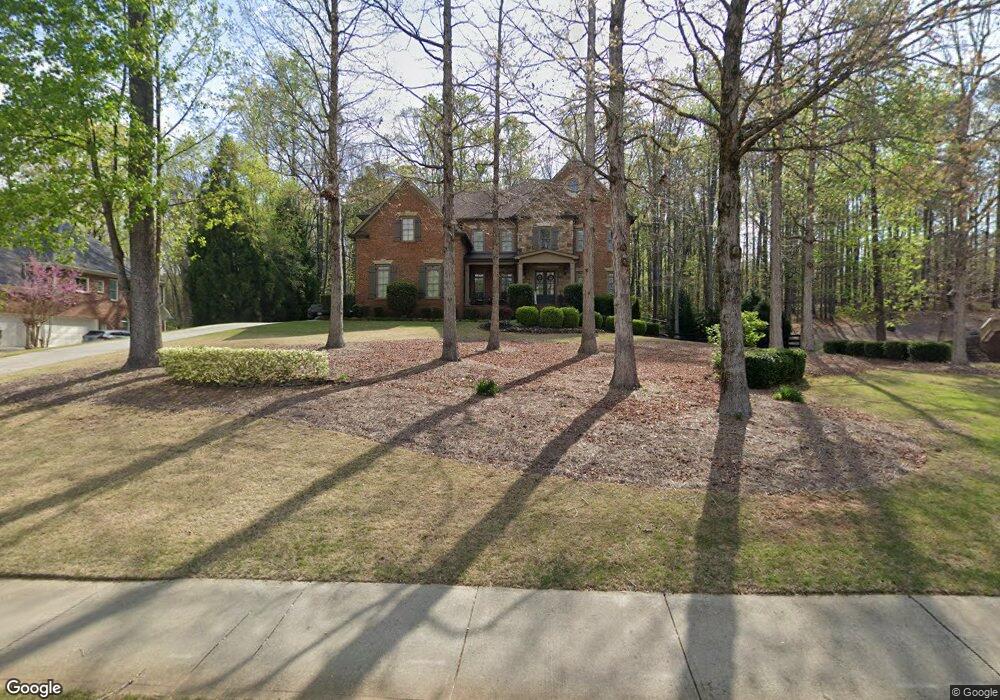
1129 Bream Dr Alpharetta, GA 30004
Estimated Value: $1,393,448 - $1,647,000
5
Beds
6
Baths
5,274
Sq Ft
$291/Sq Ft
Est. Value
About This Home
This home is located at 1129 Bream Dr, Alpharetta, GA 30004 and is currently estimated at $1,532,112, approximately $290 per square foot. 1129 Bream Dr is a home located in Fulton County with nearby schools including Birmingham Falls Elementary School, Northwestern Middle School, and Milton High School.
Ownership History
Date
Name
Owned For
Owner Type
Purchase Details
Closed on
Jun 22, 2009
Sold by
Smith Richard R and Smith Julia E
Bought by
Reed Eric L and Reed Christina
Current Estimated Value
Home Financials for this Owner
Home Financials are based on the most recent Mortgage that was taken out on this home.
Original Mortgage
$417,000
Outstanding Balance
$263,750
Interest Rate
4.79%
Mortgage Type
New Conventional
Estimated Equity
$1,268,362
Purchase Details
Closed on
Nov 16, 2007
Sold by
Bill Roberts Homes Inc
Bought by
Smith Richard R and Smith Julia E
Home Financials for this Owner
Home Financials are based on the most recent Mortgage that was taken out on this home.
Original Mortgage
$580,000
Interest Rate
6.26%
Mortgage Type
New Conventional
Purchase Details
Closed on
May 26, 2005
Sold by
Lsi & Newman Llc
Bought by
Bill Roberts Homes Inc
Home Financials for this Owner
Home Financials are based on the most recent Mortgage that was taken out on this home.
Original Mortgage
$548,000
Interest Rate
5.74%
Create a Home Valuation Report for This Property
The Home Valuation Report is an in-depth analysis detailing your home's value as well as a comparison with similar homes in the area
Home Values in the Area
Average Home Value in this Area
Purchase History
| Date | Buyer | Sale Price | Title Company |
|---|---|---|---|
| Reed Eric L | $620,000 | -- | |
| Smith Richard R | $725,000 | -- | |
| Bill Roberts Homes Inc | $185,000 | -- |
Source: Public Records
Mortgage History
| Date | Status | Borrower | Loan Amount |
|---|---|---|---|
| Open | Reed Eric L | $417,000 | |
| Previous Owner | Smith Richard R | $580,000 | |
| Previous Owner | Bill Roberts Homes Inc | $548,000 |
Source: Public Records
Tax History
| Year | Tax Paid | Tax Assessment Tax Assessment Total Assessment is a certain percentage of the fair market value that is determined by local assessors to be the total taxable value of land and additions on the property. | Land | Improvement |
|---|---|---|---|---|
| 2025 | $1,297 | $480,120 | $137,600 | $342,520 |
| 2023 | $1,297 | $428,880 | $114,840 | $314,040 |
| 2022 | $7,004 | $311,440 | $90,240 | $221,200 |
| 2021 | $6,736 | $273,960 | $63,080 | $210,880 |
| 2020 | $6,814 | $270,720 | $62,360 | $208,360 |
| 2019 | $1,244 | $265,920 | $61,240 | $204,680 |
| 2018 | $6,988 | $259,680 | $59,800 | $199,880 |
| 2017 | $6,507 | $234,960 | $55,040 | $179,920 |
| 2016 | $6,506 | $234,960 | $55,040 | $179,920 |
| 2015 | $7,573 | $234,960 | $55,040 | $179,920 |
| 2014 | $6,102 | $211,800 | $49,360 | $162,440 |
Source: Public Records
Map
Nearby Homes
- 1099 Bream Dr
- 15750 Freemanville Rd
- 1060 Birmingham Rd
- 10155 Cedar Ridge Dr
- 1505 Bon Endriot Ct
- 10190 Cedar Ridge Dr
- 1057 Crossroads Trail
- 1009 Crossroads Trail
- 1013 Crossroads Trail
- 10210 Cedar Ridge Dr
- 1029 Crossroads Trail
- 15775 Bon Endriot Dr
- 2035 Village Walk
- 2031 Village Walk
- 10310 Magnolia Meadow Ct
- 16750 Quayside Dr
- 15560 Freemanville Rd
- 10270 Cedar Ridge Dr
- 1160 Nix Rd
- 15595 Birmingham Hwy
Your Personal Tour Guide
Ask me questions while you tour the home.