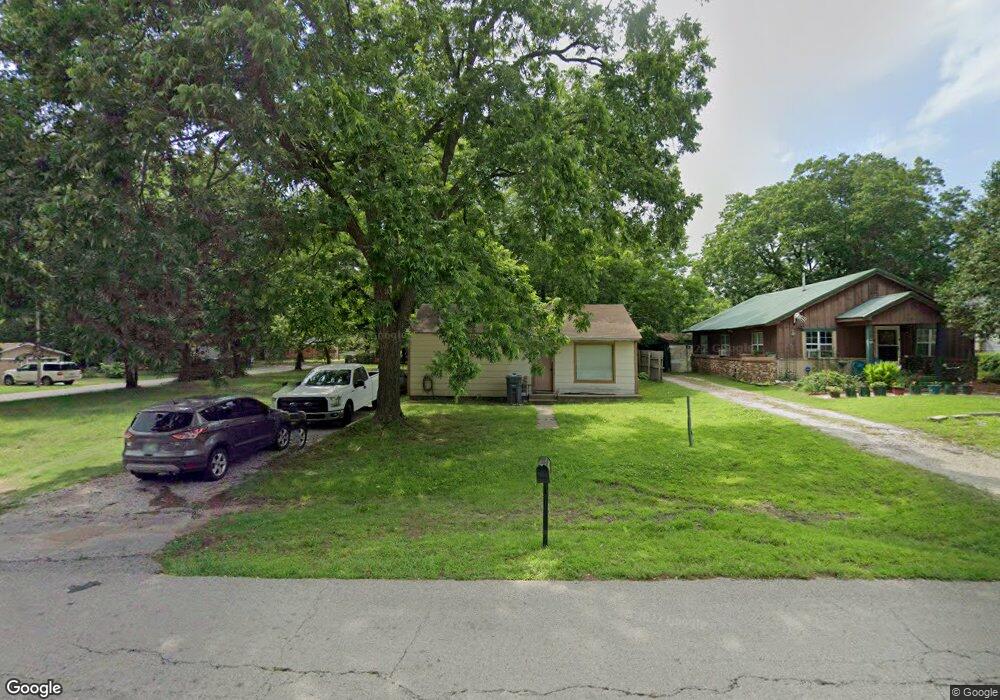
1129 C St SE Ardmore, OK 73401
Estimated Value: $71,050 - $103,000
2
Beds
1
Bath
832
Sq Ft
$102/Sq Ft
Est. Value
About This Home
This home is located at 1129 C St SE, Ardmore, OK 73401 and is currently estimated at $84,513, approximately $101 per square foot. 1129 C St SE is a home located in Carter County with nearby schools including Jefferson Elementary School, Ardmore Middle School, and Ardmore High School.
Ownership History
Date
Name
Owned For
Owner Type
Purchase Details
Closed on
Nov 9, 2016
Sold by
Marris Roy C and Marris Bonita
Bought by
Miller Patrick Lynn
Current Estimated Value
Home Financials for this Owner
Home Financials are based on the most recent Mortgage that was taken out on this home.
Original Mortgage
$19,269
Interest Rate
3.42%
Mortgage Type
Future Advance Clause Open End Mortgage
Purchase Details
Closed on
Sep 28, 1994
Sold by
Atwood Carl G
Bought by
Marris Roy C and Marris Bonita
Create a Home Valuation Report for This Property
The Home Valuation Report is an in-depth analysis detailing your home's value as well as a comparison with similar homes in the area
Home Values in the Area
Average Home Value in this Area
Purchase History
| Date | Buyer | Sale Price | Title Company |
|---|---|---|---|
| Miller Patrick Lynn | $18,500 | Stewart Abstract & Title | |
| Marris Roy C | $8,000 | -- |
Source: Public Records
Mortgage History
| Date | Status | Borrower | Loan Amount |
|---|---|---|---|
| Closed | Miller Patrick Lynn | $19,269 |
Source: Public Records
Tax History Compared to Growth
Tax History
| Year | Tax Paid | Tax Assessment Tax Assessment Total Assessment is a certain percentage of the fair market value that is determined by local assessors to be the total taxable value of land and additions on the property. | Land | Improvement |
|---|---|---|---|---|
| 2024 | $170 | $2,730 | $554 | $2,176 |
| 2023 | $163 | $2,650 | $541 | $2,109 |
| 2022 | $150 | $2,573 | $526 | $2,047 |
| 2021 | $151 | $2,498 | $505 | $1,993 |
| 2020 | $142 | $2,426 | $480 | $1,946 |
| 2019 | $132 | $2,355 | $480 | $1,875 |
| 2018 | $127 | $2,287 | $480 | $1,807 |
| 2017 | $203 | $2,220 | $480 | $1,740 |
| 2016 | $195 | $2,093 | $381 | $1,712 |
| 2015 | $153 | $1,993 | $259 | $1,734 |
| 2014 | $146 | $1,898 | $259 | $1,639 |
Source: Public Records
Map
Nearby Homes
- 210 9th Ave SE
- 1000 Hugo St SE
- 837 C St SE
- 901 A St SE
- 812 C St SE
- 1118 Heath St SE
- 1108 Douglas St SE
- 1024 C St SW
- 808 Carter St SE
- 511 7th Ave SE
- 616 8th Ave SE
- 613 F St SW
- 603 6th Ave SE
- 914 Hailey St SW
- 310 4th Ave SE
- 513 Lake Murray Dr E
- 403 Carter St SE
- 1014 S Commerce St
- 426 E St SE
- 417 E St SE