1129 E 566 Rd Locust Grove, OK 74352
Estimated Value: $95,000 - $148,000
3
Beds
2
Baths
1,224
Sq Ft
$101/Sq Ft
Est. Value
About This Home
This home is located at 1129 E 566 Rd, Locust Grove, OK 74352 and is currently estimated at $124,191, approximately $101 per square foot. 1129 E 566 Rd is a home located in Mayes County with nearby schools including Locust Grove Early Lrning Center, Locust Grove Upper Elementary School, and Locust Grove Middle School.
Ownership History
Date
Name
Owned For
Owner Type
Purchase Details
Closed on
Mar 22, 2012
Sold by
Fannie Mae
Bought by
Millikin Tamera
Current Estimated Value
Purchase Details
Closed on
Nov 21, 2011
Sold by
Cunningham Shannon L and Doe John
Bought by
Fannie Mae and Federal National Mortgage Association
Purchase Details
Closed on
Aug 16, 2005
Sold by
Odom J B and Odom Betty Jo
Bought by
Cunningham Shannon L
Home Financials for this Owner
Home Financials are based on the most recent Mortgage that was taken out on this home.
Original Mortgage
$66,405
Interest Rate
5.51%
Mortgage Type
New Conventional
Create a Home Valuation Report for This Property
The Home Valuation Report is an in-depth analysis detailing your home's value as well as a comparison with similar homes in the area
Home Values in the Area
Average Home Value in this Area
Purchase History
| Date | Buyer | Sale Price | Title Company |
|---|---|---|---|
| Millikin Tamera | $23,000 | None Available | |
| Fannie Mae | $63,566 | None Available | |
| Cunningham Shannon L | $70,000 | None Available |
Source: Public Records
Mortgage History
| Date | Status | Borrower | Loan Amount |
|---|---|---|---|
| Previous Owner | Cunningham Shannon L | $66,405 |
Source: Public Records
Tax History Compared to Growth
Tax History
| Year | Tax Paid | Tax Assessment Tax Assessment Total Assessment is a certain percentage of the fair market value that is determined by local assessors to be the total taxable value of land and additions on the property. | Land | Improvement |
|---|---|---|---|---|
| 2025 | $610 | $7,784 | $2,005 | $5,779 |
| 2023 | $610 | $7,338 | $2,005 | $5,333 |
| 2022 | $553 | $7,124 | $2,005 | $5,119 |
| 2021 | $545 | $6,917 | $2,005 | $4,912 |
| 2020 | $534 | $6,715 | $2,005 | $4,710 |
| 2019 | $539 | $6,759 | $1,590 | $5,169 |
| 2018 | $550 | $6,759 | $1,590 | $5,169 |
| 2017 | $550 | $6,759 | $1,590 | $5,169 |
| 2016 | $537 | $6,759 | $1,590 | $5,169 |
| 2015 | $555 | $6,759 | $1,590 | $5,169 |
| 2014 | $651 | $6,759 | $1,590 | $5,169 |
Source: Public Records
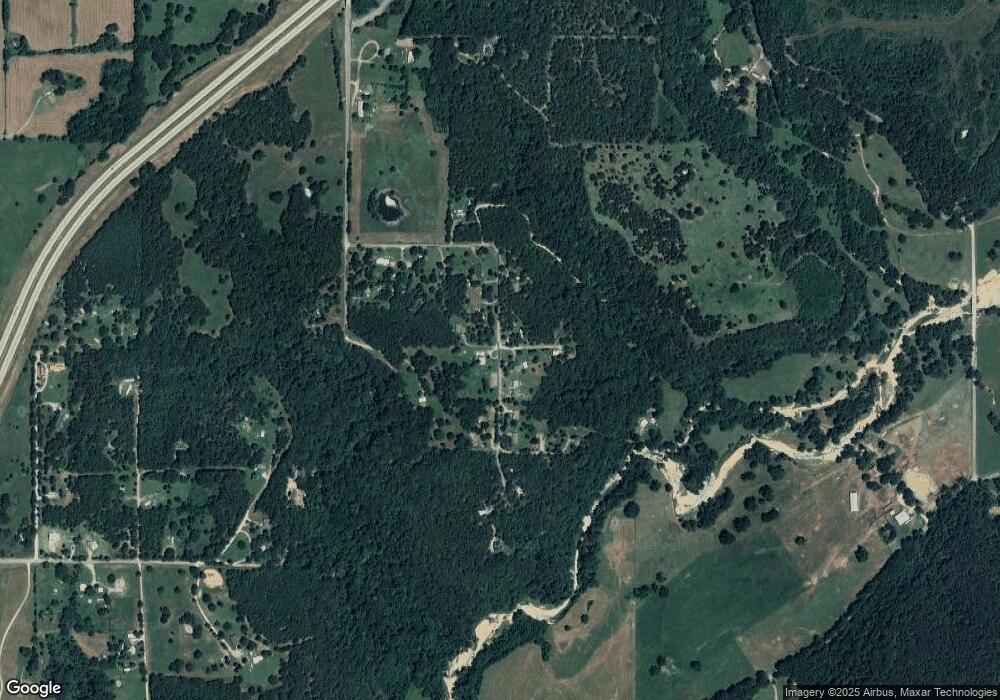
Map
Nearby Homes