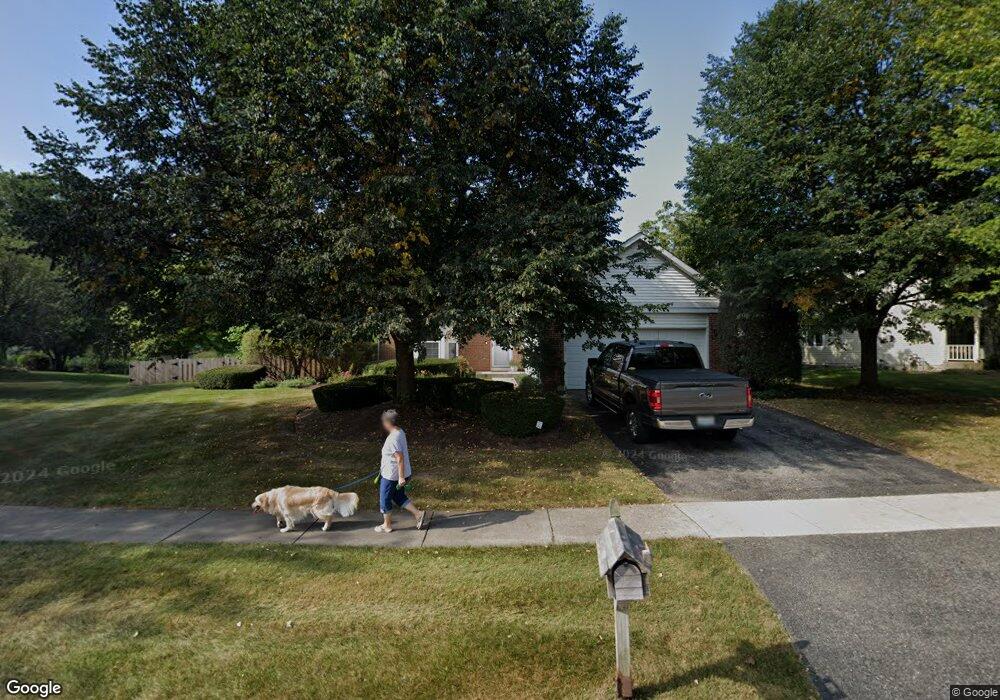
1129 E Fox Chase Dr Round Lake Beach, IL 60073
Estimated Value: $367,000 - $389,833
3
Beds
3
Baths
2,008
Sq Ft
$191/Sq Ft
Est. Value
About This Home
This home is located at 1129 E Fox Chase Dr, Round Lake Beach, IL 60073 and is currently estimated at $383,208, approximately $190 per square foot. 1129 E Fox Chase Dr is a home located in Lake County with nearby schools including Avon Center Elementary School, Frederick School, and Grayslake Middle School.
Ownership History
Date
Name
Owned For
Owner Type
Purchase Details
Closed on
May 16, 2025
Sold by
Cappelli Richard L and Cappelli Rebecca S
Bought by
Cappelli Revocable Family Trust and Cappelli
Current Estimated Value
Purchase Details
Closed on
Jul 31, 2002
Sold by
Adams Steave D and Adams Sonja M
Bought by
Cappelli Richard L and Cappelli Rebecca S
Home Financials for this Owner
Home Financials are based on the most recent Mortgage that was taken out on this home.
Original Mortgage
$184,400
Interest Rate
6.64%
Purchase Details
Closed on
Nov 20, 2000
Sold by
Lakewood Hills Llc
Bought by
Adams Steave D and Adams Sonja M
Home Financials for this Owner
Home Financials are based on the most recent Mortgage that was taken out on this home.
Original Mortgage
$170,000
Interest Rate
7.86%
Create a Home Valuation Report for This Property
The Home Valuation Report is an in-depth analysis detailing your home's value as well as a comparison with similar homes in the area
Home Values in the Area
Average Home Value in this Area
Purchase History
| Date | Buyer | Sale Price | Title Company |
|---|---|---|---|
| Cappelli Revocable Family Trust | -- | None Listed On Document | |
| Cappelli Richard L | $230,500 | -- | |
| Adams Steave D | $220,000 | Chicago Title Insurance Co |
Source: Public Records
Mortgage History
| Date | Status | Borrower | Loan Amount |
|---|---|---|---|
| Previous Owner | Cappelli Richard L | $184,400 | |
| Previous Owner | Adams Steave D | $170,000 |
Source: Public Records
Tax History Compared to Growth
Tax History
| Year | Tax Paid | Tax Assessment Tax Assessment Total Assessment is a certain percentage of the fair market value that is determined by local assessors to be the total taxable value of land and additions on the property. | Land | Improvement |
|---|---|---|---|---|
| 2024 | $10,425 | $103,595 | $17,631 | $85,964 |
| 2023 | $9,767 | $91,531 | $15,578 | $75,953 |
| 2022 | $9,767 | $82,511 | $13,597 | $68,914 |
| 2021 | $9,374 | $76,648 | $12,631 | $64,017 |
| 2020 | $9,548 | $74,192 | $12,226 | $61,966 |
| 2019 | $9,252 | $71,304 | $11,750 | $59,554 |
| 2018 | $9,503 | $71,344 | $15,686 | $55,658 |
| 2017 | $9,567 | $69,442 | $15,268 | $54,174 |
| 2016 | $9,514 | $66,630 | $14,650 | $51,980 |
| 2015 | $9,468 | $62,231 | $13,683 | $48,548 |
| 2014 | $9,081 | $62,201 | $12,984 | $49,217 |
| 2012 | $8,326 | $62,501 | $13,047 | $49,454 |
Source: Public Records
Map
Nearby Homes
- 1290 E Fox Chase Dr Unit 1
- 941 Martingale Ln
- 2354 Scott Ct
- 278 Crozier Dr
- 250 Crozier Dr
- 2755 Sheldon Rd
- 2814 Phillip Dr
- 253 Frances Dr
- 36664 N Helen Dr
- 239 Frances Dr
- 2325 N Lenox Ct
- 21556 W Sarah Dr
- 36661 N Oakwood Dr
- 211 Frances Dr
- 36915 N Mary Dr
- 681 E Peachtree Ln
- 36909 N Marilyn Ln
- 21290 W Engle Dr
- 21974 W Engle Dr
- 36866 N Nathan Hale Dr Unit N
- 1143 E Fox Chase Dr Unit 1
- 2345 Woodoak Dr
- 2335 Woodoak Dr Unit 1
- 2355 Woodoak Dr
- 2325 Woodoak Dr
- 2326 N Tedy Ln
- 2346 N Tedy Ln
- 2315 Woodoak Dr
- 2316 N Tedy Ln
- 2358 N Tedy Ln
- 2306 N Tedy Ln
- 2346 Woodoak Dr
- 2296 N Tedy Ln
- 2364 N Tedy Ln
- 2336 Woodoak Dr
- 2356 Woodoak Dr
- 2326 Woodoak Dr
- 2316 Woodoak Dr
- 2325 N Tedy Ln
- 2290 N Tedy Ln