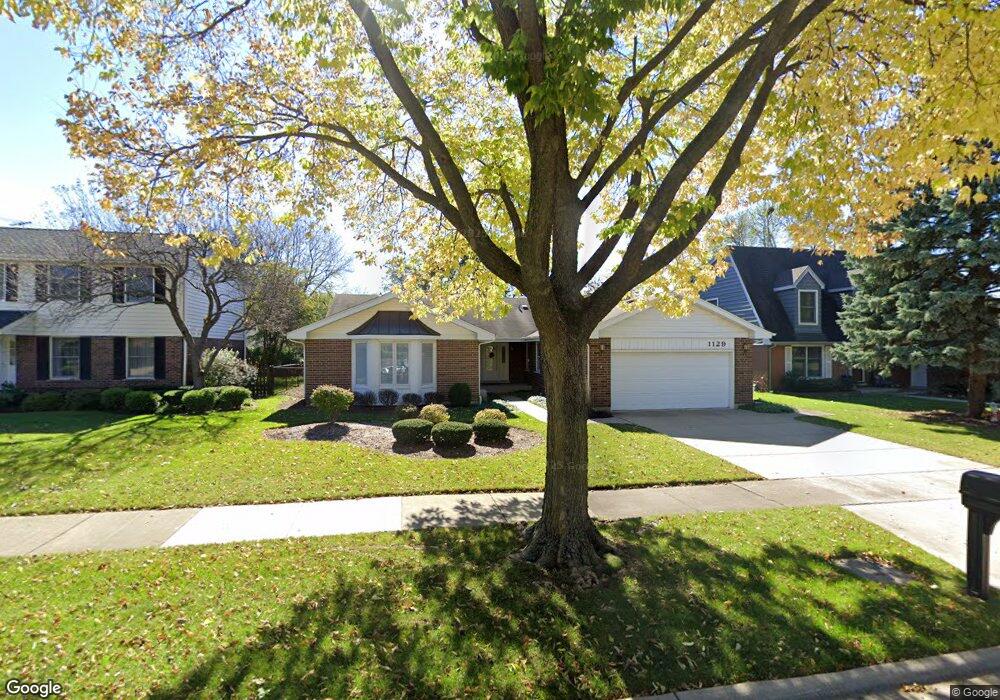
1129 E Vargo Ln Arlington Heights, IL 60004
Ivy Hill NeighborhoodEstimated Value: $664,598 - $747,000
3
Beds
3
Baths
2,425
Sq Ft
$291/Sq Ft
Est. Value
About This Home
This home is located at 1129 E Vargo Ln, Arlington Heights, IL 60004 and is currently estimated at $705,400, approximately $290 per square foot. 1129 E Vargo Ln is a home located in Cook County with nearby schools including Ivy Hill Elementary School, Thomas Middle School, and Buffalo Grove High School.
Ownership History
Date
Name
Owned For
Owner Type
Purchase Details
Closed on
May 27, 2016
Sold by
Weritz John G and Weritz Margaret
Bought by
John And Margaret Weritz Trust
Current Estimated Value
Purchase Details
Closed on
Aug 31, 2006
Sold by
Kirkpatrick David M and Kirpatrick Patricia G
Bought by
Weritz John W and Weritz Margaret
Home Financials for this Owner
Home Financials are based on the most recent Mortgage that was taken out on this home.
Original Mortgage
$486,400
Interest Rate
6.37%
Mortgage Type
Unknown
Purchase Details
Closed on
Jul 27, 2005
Sold by
Kirkpatrick David M and Kirkpatrick Patricia G
Bought by
Kirkpatrick Patricia G and Kirkpatrick David M
Purchase Details
Closed on
Nov 11, 1999
Sold by
Cole Taylor Bank
Bought by
Kirkpatrick David M and Kirkpatrick Patricia G
Purchase Details
Closed on
May 15, 1996
Sold by
Kirkpatrick David M and Kirkpatrick Patricia G
Bought by
Cole Taylor Bank
Create a Home Valuation Report for This Property
The Home Valuation Report is an in-depth analysis detailing your home's value as well as a comparison with similar homes in the area
Home Values in the Area
Average Home Value in this Area
Purchase History
| Date | Buyer | Sale Price | Title Company |
|---|---|---|---|
| John And Margaret Weritz Trust | -- | Attorney | |
| Weritz John W | $608,000 | Multiple | |
| Kirkpatrick Patricia G | -- | -- | |
| Kirkpatrick David M | -- | -- | |
| Cole Taylor Bank | -- | First American Title | |
| Kirkpatrick David | $402,000 | First American Title |
Source: Public Records
Mortgage History
| Date | Status | Borrower | Loan Amount |
|---|---|---|---|
| Previous Owner | Weritz John W | $486,400 |
Source: Public Records
Tax History Compared to Growth
Tax History
| Year | Tax Paid | Tax Assessment Tax Assessment Total Assessment is a certain percentage of the fair market value that is determined by local assessors to be the total taxable value of land and additions on the property. | Land | Improvement |
|---|---|---|---|---|
| 2024 | $10,686 | $45,000 | $9,625 | $35,375 |
| 2023 | $10,241 | $45,000 | $9,625 | $35,375 |
| 2022 | $10,241 | $45,000 | $9,625 | $35,375 |
| 2021 | $9,203 | $36,566 | $5,468 | $31,098 |
| 2020 | $9,085 | $36,566 | $5,468 | $31,098 |
| 2019 | $9,082 | $40,765 | $5,468 | $35,297 |
| 2018 | $9,153 | $37,550 | $4,812 | $32,738 |
| 2017 | $9,077 | $37,550 | $4,812 | $32,738 |
| 2016 | $8,948 | $37,550 | $4,812 | $32,738 |
| 2015 | $8,812 | $34,342 | $4,156 | $30,186 |
| 2014 | $9,108 | $34,342 | $4,156 | $30,186 |
| 2013 | $8,862 | $34,342 | $4,156 | $30,186 |
Source: Public Records
Map
Nearby Homes
- 1424 E Jonquil Cir
- 715 E Valley Ln
- 2620 N Windsor Dr Unit 201
- 2608 N Wilshire Ln
- 504 E Sunset Dr
- 2604 N Windsor Dr Unit 206
- 2632 N Windsor Dr Unit 104
- 1519 E Arbor Ln
- 214 E Ivy Ln
- 2640 N Windsor Dr Unit 102
- 1925 E Waverly Ln
- 2624 N Prindle Ave
- 2315 N Arlington Heights Rd
- 2100 N Ridge Rd
- 2616 N Prindle Ave
- 2143 E Peachtree Ln
- 1038 Harbour Ct Unit 2A
- 1670 N Douglas Ct Unit 86
- 1500 Harbour Dr Unit 1D
- 1500 Harbour Dr Unit 2K
- 1121 E Vargo Ln
- 1207 E Vargo Ln Unit 12
- 1128 E Valley Ln
- 1111 E Vargo Ln
- 1215 E Vargo Ln
- 1132 E Valley Ln
- 1124 E Valley Ln
- 1204 E Valley Ln
- 1122 E Vargo Ln
- 1118 E Valley Ln
- 1208 E Vargo Ln
- 1221 E Vargo Ln
- 1105 E Vargo Ln
- 1112 E Vargo Ln
- 1214 E Valley Ln
- 1212 E Vargo Ln
- 1110 E Valley Ln
- 1104 E Vargo Ln
- 1220 E Vargo Ln
- 2235 N Dryden Ln