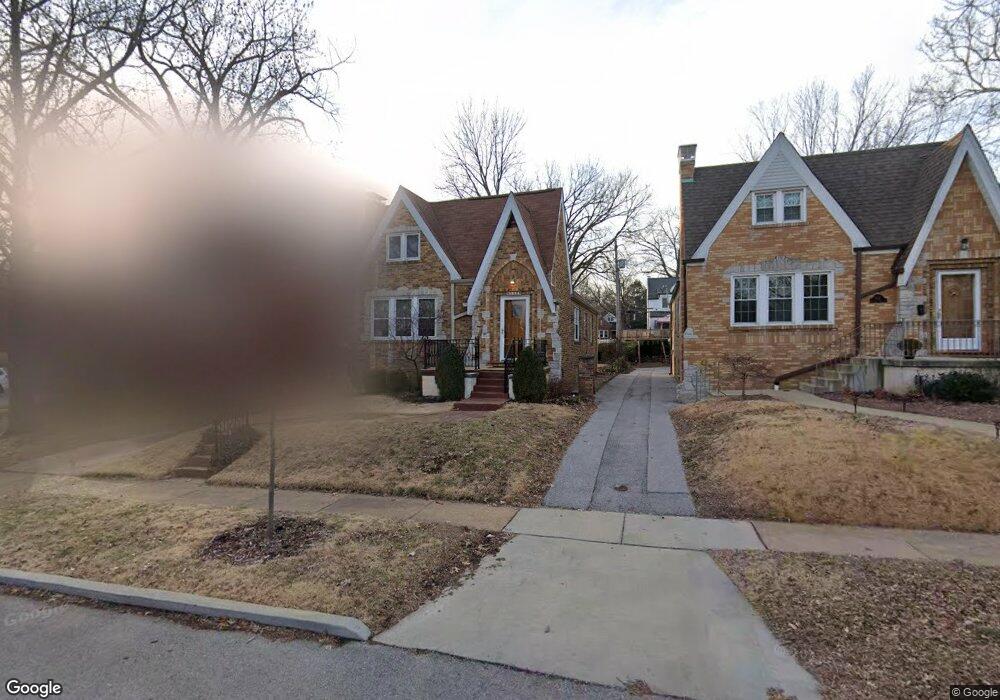
1129 Edward Terrace Saint Louis, MO 63117
Estimated Value: $333,035 - $471,000
2
Beds
1
Bath
1,404
Sq Ft
$289/Sq Ft
Est. Value
About This Home
This home is located at 1129 Edward Terrace, Saint Louis, MO 63117 and is currently estimated at $406,009, approximately $289 per square foot. 1129 Edward Terrace is a home located in St. Louis County with nearby schools including Maplewood Richmond Heights Elementary School, Maplewood Richmond Heights Middle School, and Maplewood-Richmond Heights High School.
Ownership History
Date
Name
Owned For
Owner Type
Purchase Details
Closed on
May 27, 1999
Sold by
Carroll Shawn and Carroll Melissa
Bought by
Fritsch Susanne M
Current Estimated Value
Home Financials for this Owner
Home Financials are based on the most recent Mortgage that was taken out on this home.
Original Mortgage
$142,800
Outstanding Balance
$36,439
Interest Rate
6.89%
Mortgage Type
Purchase Money Mortgage
Estimated Equity
$369,570
Purchase Details
Closed on
Jun 1, 1998
Sold by
Jetal English Anna and Jetal Elizabeth Mary
Bought by
Carroll Shawn and Carroll Melissa
Home Financials for this Owner
Home Financials are based on the most recent Mortgage that was taken out on this home.
Original Mortgage
$112,000
Interest Rate
7.2%
Mortgage Type
Purchase Money Mortgage
Purchase Details
Closed on
Jan 22, 1998
Sold by
Smith Mary Elizabeth
Bought by
English Anna J
Create a Home Valuation Report for This Property
The Home Valuation Report is an in-depth analysis detailing your home's value as well as a comparison with similar homes in the area
Home Values in the Area
Average Home Value in this Area
Purchase History
| Date | Buyer | Sale Price | Title Company |
|---|---|---|---|
| Fritsch Susanne M | $178,500 | -- | |
| Carroll Shawn | -- | -- | |
| English Anna J | -- | -- |
Source: Public Records
Mortgage History
| Date | Status | Borrower | Loan Amount |
|---|---|---|---|
| Open | Fritsch Susanne M | $142,800 | |
| Previous Owner | Carroll Shawn | $112,000 |
Source: Public Records
Tax History Compared to Growth
Tax History
| Year | Tax Paid | Tax Assessment Tax Assessment Total Assessment is a certain percentage of the fair market value that is determined by local assessors to be the total taxable value of land and additions on the property. | Land | Improvement |
|---|---|---|---|---|
| 2025 | $4,030 | $60,670 | $37,010 | $23,660 |
| 2024 | $4,030 | $52,540 | $24,230 | $28,310 |
| 2023 | $3,994 | $52,540 | $24,230 | $28,310 |
| 2022 | $3,799 | $46,210 | $24,230 | $21,980 |
| 2021 | $3,734 | $46,210 | $24,230 | $21,980 |
| 2020 | $3,917 | $46,000 | $18,850 | $27,150 |
| 2019 | $3,887 | $46,000 | $18,850 | $27,150 |
| 2018 | $3,732 | $40,070 | $17,100 | $22,970 |
| 2017 | $3,707 | $40,070 | $17,100 | $22,970 |
| 2016 | $3,741 | $39,010 | $15,200 | $23,810 |
| 2015 | $3,515 | $39,010 | $15,200 | $23,810 |
| 2014 | $3,083 | $34,220 | $9,010 | $25,210 |
Source: Public Records
Map
Nearby Homes
- 7742 Wise Ave
- 1140 Hillside Dr
- 1123 Claytonia Terrace
- 1174 Claytonia Terrace
- 1109 Claytonia Terrace
- 1262 Moorlands Dr
- 1026 Claytonia Terrace
- 7716 Lovella Ave
- 7715 Dale Ave
- 7723 Dale Ave
- 1250 Hampton Park Dr
- 7501 Cromwell Dr Unit 1
- 7524 Cromwell Dr Unit 3PH
- 7532 Cromwell Dr Unit 1S
- 7735 Saint Albans Ave
- 7544 York Dr Unit 3W
- 7544 York Dr Unit 3E
- 61 Lake Forest Dr
- 7545 Wellington Way Unit 2B
- 7547 Wellington Way Unit 2C
- 1127 Edward Terrace
- 1133 Edward Terrace
- 1125 Edward Terrace
- 1123 Edward Terrace
- 1148 Boland Place
- 1160 Boland Place
- 1146 Boland Place
- 1121 Edward Terrace
- 1144 Edward Terrace
- 1144 Boland Place
- 1142 Edward Terrace
- 1140 Edward Terrace
- 1146 Edward Terrace
- 7752 Wise Ave
- 1138 Edward Terrace
- 7766 Wise Ave
- 1119 Edward Terrace
- 1140 Boland Place
- 7764 Wise Ave
- 1126 Edward Terrace