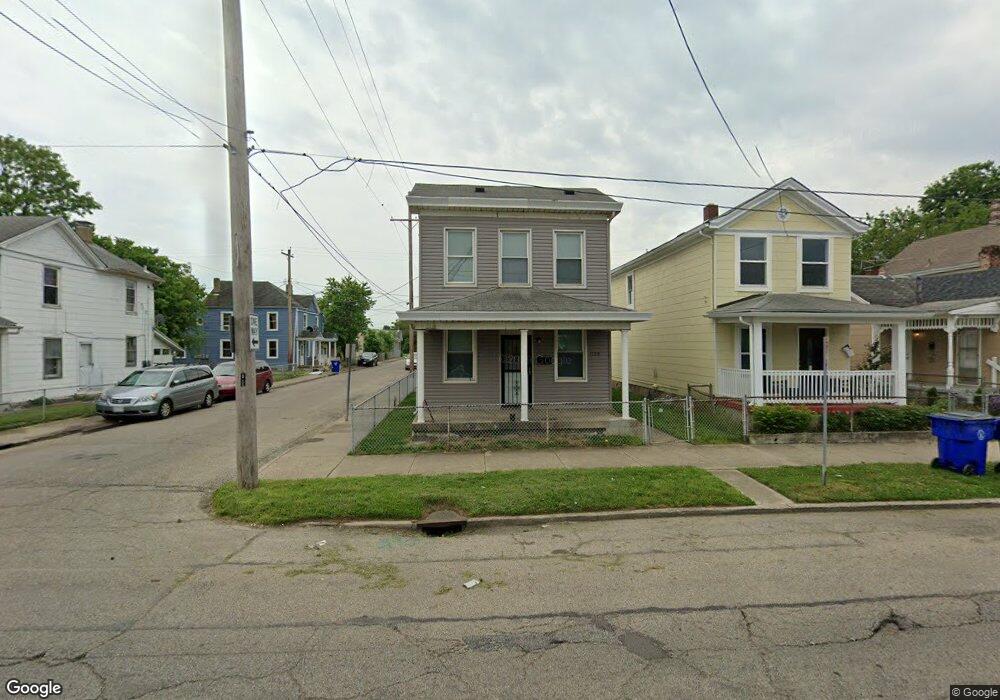
1129 Maple Ave Hamilton, OH 45011
East Hamilton NeighborhoodEstimated Value: $90,571 - $101,000
2
Beds
2
Baths
1,152
Sq Ft
$81/Sq Ft
Est. Value
About This Home
This home is located at 1129 Maple Ave, Hamilton, OH 45011 and is currently estimated at $93,393, approximately $81 per square foot. 1129 Maple Ave is a home located in Butler County with nearby schools including Riverview Elementary School, Garfield Middle School, and Hamilton Freshman School.
Ownership History
Date
Name
Owned For
Owner Type
Purchase Details
Closed on
Aug 20, 2019
Sold by
Jackson Rebecca L
Bought by
Jackson David L and Jackson Joyce G
Current Estimated Value
Purchase Details
Closed on
Aug 13, 2012
Sold by
Jackson David L and Jackson David
Bought by
The Jackson Property Trust
Purchase Details
Closed on
Jun 29, 2006
Sold by
Coffey Sandra K and Coffey Timothy
Bought by
Jackson David and Jackson Joyce G
Purchase Details
Closed on
Nov 11, 2003
Sold by
Miller John C and Miller John Clyde
Bought by
Coffey Sandra K and Miller John C
Create a Home Valuation Report for This Property
The Home Valuation Report is an in-depth analysis detailing your home's value as well as a comparison with similar homes in the area
Home Values in the Area
Average Home Value in this Area
Purchase History
| Date | Buyer | Sale Price | Title Company |
|---|---|---|---|
| Jackson David L | -- | None Available | |
| Jackson Rebecca L | -- | None Available | |
| The Jackson Property Trust | -- | None Available | |
| Jackson David | $35,000 | None Available | |
| Coffey Sandra K | -- | -- |
Source: Public Records
Tax History
| Year | Tax Paid | Tax Assessment Tax Assessment Total Assessment is a certain percentage of the fair market value that is determined by local assessors to be the total taxable value of land and additions on the property. | Land | Improvement |
|---|---|---|---|---|
| 2025 | $579 | $11,780 | $850 | $10,930 |
| 2024 | $579 | $11,780 | $850 | $10,930 |
| 2023 | $554 | $11,780 | $850 | $10,930 |
| 2022 | $540 | $9,580 | $850 | $8,730 |
| 2021 | $474 | $9,210 | $850 | $8,360 |
| 2020 | $492 | $9,210 | $850 | $8,360 |
| 2019 | $293 | $5,030 | $900 | $4,130 |
| 2018 | $286 | $5,030 | $900 | $4,130 |
| 2017 | $288 | $5,030 | $900 | $4,130 |
| 2016 | $282 | $4,670 | $900 | $3,770 |
| 2015 | $235 | $4,670 | $900 | $3,770 |
| 2014 | $394 | $4,670 | $900 | $3,770 |
| 2013 | $394 | $7,360 | $2,170 | $5,190 |
Source: Public Records
Map
Nearby Homes
Your Personal Tour Guide
Ask me questions while you tour the home.