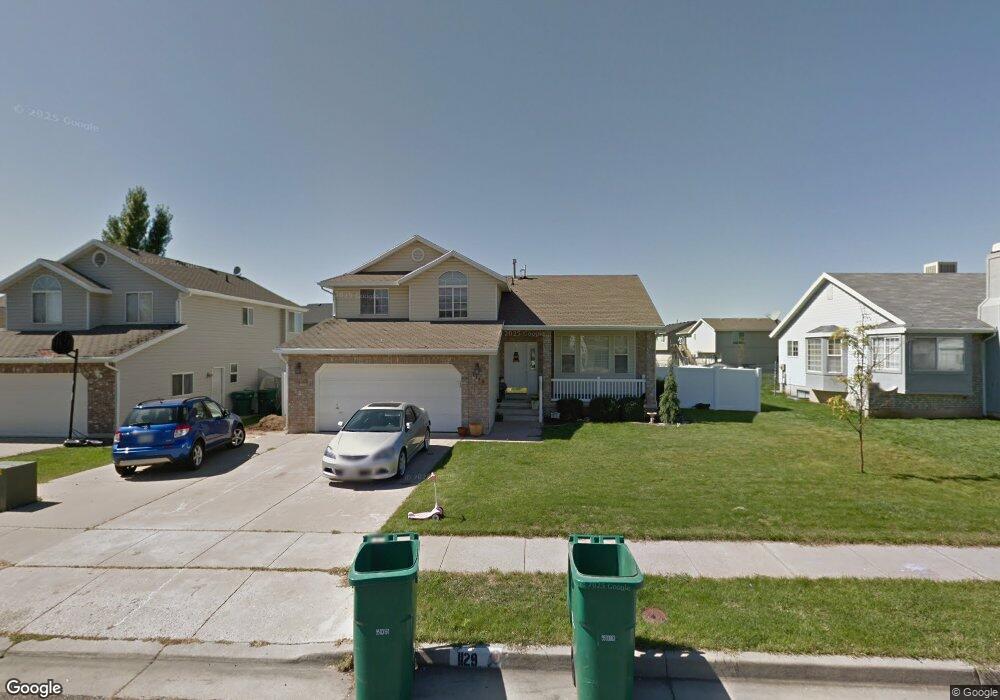
1129 N 2925 W Layton, UT 84041
Estimated Value: $507,000 - $532,000
4
Beds
4
Baths
2,335
Sq Ft
$223/Sq Ft
Est. Value
About This Home
This home is located at 1129 N 2925 W, Layton, UT 84041 and is currently estimated at $519,994, approximately $222 per square foot. 1129 N 2925 W is a home located in Davis County with nearby schools including Legacy Junior High School, Layton High School, and North Davis Preparatory Academy.
Ownership History
Date
Name
Owned For
Owner Type
Purchase Details
Closed on
Oct 3, 2023
Sold by
Thornley Investment Group Llc
Bought by
Thornley Thursday
Current Estimated Value
Home Financials for this Owner
Home Financials are based on the most recent Mortgage that was taken out on this home.
Original Mortgage
$63,000
Outstanding Balance
$61,730
Interest Rate
7.23%
Mortgage Type
New Conventional
Estimated Equity
$458,264
Purchase Details
Closed on
Apr 12, 2012
Sold by
Thornley Thursday
Bought by
Thornley Thursday
Purchase Details
Closed on
Sep 30, 2004
Sold by
Mortensen Matthew J and Mortensen Kathleen P
Bought by
Thornley Thursday
Purchase Details
Closed on
May 30, 2001
Sold by
Fisher H Blaine and Fisher Diane E
Bought by
Mortensen Matthew J and Mortensen Kathleen P
Home Financials for this Owner
Home Financials are based on the most recent Mortgage that was taken out on this home.
Original Mortgage
$100,000
Interest Rate
7.15%
Purchase Details
Closed on
Nov 1, 1999
Sold by
Keck Diane E
Bought by
Fisher H Blaine and Fisher Diane E
Create a Home Valuation Report for This Property
The Home Valuation Report is an in-depth analysis detailing your home's value as well as a comparison with similar homes in the area
Home Values in the Area
Average Home Value in this Area
Purchase History
| Date | Buyer | Sale Price | Title Company |
|---|---|---|---|
| Thornley Thursday | -- | Lincoln Title | |
| Thornley Thursday | -- | None Available | |
| Thornley Thursday | -- | First American Title Co | |
| Mortensen Matthew J | -- | Bonneville Title Company Inc | |
| Fisher H Blaine | -- | Security Title Company | |
| Fisher H Blaine | -- | Security Title Company |
Source: Public Records
Mortgage History
| Date | Status | Borrower | Loan Amount |
|---|---|---|---|
| Open | Thornley Thursday | $63,000 | |
| Previous Owner | Mortensen Matthew J | $100,000 |
Source: Public Records
Tax History Compared to Growth
Tax History
| Year | Tax Paid | Tax Assessment Tax Assessment Total Assessment is a certain percentage of the fair market value that is determined by local assessors to be the total taxable value of land and additions on the property. | Land | Improvement |
|---|---|---|---|---|
| 2025 | $2,504 | $264,000 | $100,796 | $163,204 |
| 2024 | $2,429 | $256,850 | $113,518 | $143,332 |
| 2023 | $2,302 | $235,950 | $59,578 | $176,371 |
| 2022 | $2,511 | $254,100 | $70,447 | $183,653 |
| 2021 | $2,266 | $342,000 | $105,717 | $236,283 |
| 2020 | $2,044 | $296,000 | $88,159 | $207,841 |
| 2019 | $1,981 | $281,000 | $92,598 | $188,402 |
| 2018 | $1,777 | $253,000 | $80,974 | $172,026 |
| 2016 | $1,626 | $119,405 | $30,732 | $88,673 |
| 2015 | $1,546 | $107,800 | $30,732 | $77,068 |
| 2014 | $1,581 | $112,757 | $30,732 | $82,025 |
| 2013 | -- | $106,647 | $28,952 | $77,695 |
Source: Public Records
Map
Nearby Homes