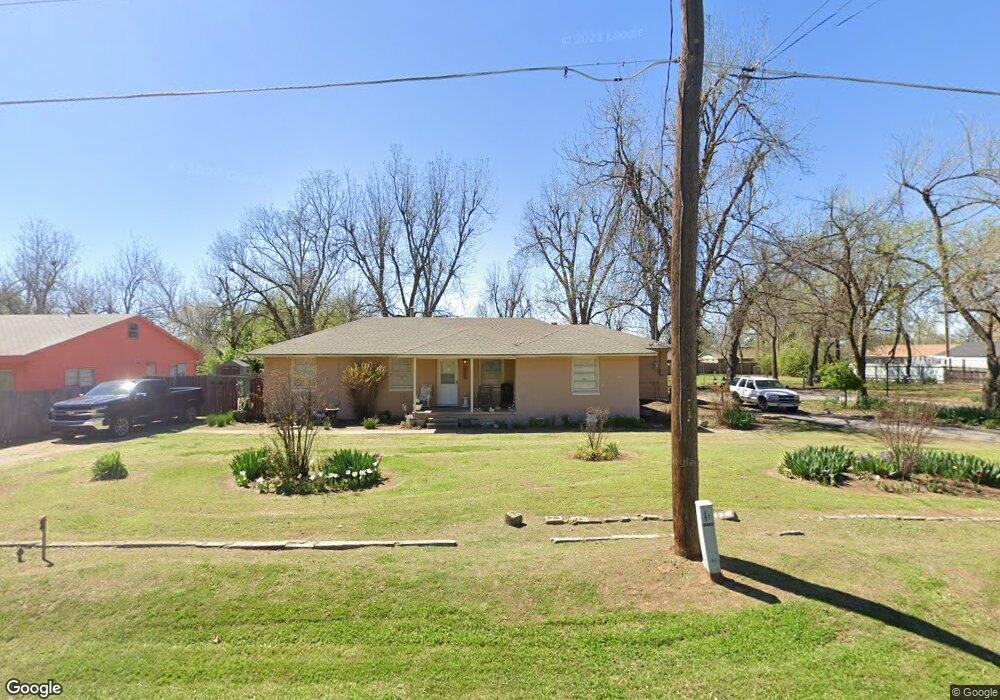
1129 N Saint John Ave Oklahoma City, OK 73110
Estimated Value: $170,000 - $203,921
4
Beds
2
Baths
1,765
Sq Ft
$105/Sq Ft
Est. Value
About This Home
This home is located at 1129 N Saint John Ave, Oklahoma City, OK 73110 and is currently estimated at $184,980, approximately $104 per square foot. 1129 N Saint John Ave is a home located in Oklahoma County with nearby schools including Willow Brook Elementary School and Star Spencer Mid-High School.
Ownership History
Date
Name
Owned For
Owner Type
Purchase Details
Closed on
Oct 27, 2006
Sold by
Terpenning Russell E and Terpenning Vickie L
Bought by
Parker Lewis
Current Estimated Value
Home Financials for this Owner
Home Financials are based on the most recent Mortgage that was taken out on this home.
Original Mortgage
$91,000
Outstanding Balance
$54,039
Interest Rate
6.28%
Mortgage Type
Unknown
Estimated Equity
$130,941
Purchase Details
Closed on
Mar 8, 2002
Sold by
Country Club Realty Co
Bought by
Atkinson Properties & Investments Inc
Purchase Details
Closed on
Aug 27, 2001
Sold by
Vandever Jobyna L and Shaw Ruben
Bought by
Terpenning Russell E and Terpenning Vickie L
Purchase Details
Closed on
Feb 18, 2001
Sold by
Vandever Jobyna L and Shaw Ruben C
Bought by
Terpenning Russell E and Terpenning Vickie L
Create a Home Valuation Report for This Property
The Home Valuation Report is an in-depth analysis detailing your home's value as well as a comparison with similar homes in the area
Home Values in the Area
Average Home Value in this Area
Purchase History
| Date | Buyer | Sale Price | Title Company |
|---|---|---|---|
| Parker Lewis | $91,000 | Lawyers Title Of Ok City Inc | |
| Atkinson Properties & Investments Inc | -- | -- | |
| Terpenning Russell E | $30,000 | -- | |
| Terpenning Russell E | $30,000 | Lawyers Title |
Source: Public Records
Mortgage History
| Date | Status | Borrower | Loan Amount |
|---|---|---|---|
| Open | Parker Lewis | $91,000 |
Source: Public Records
Tax History Compared to Growth
Tax History
| Year | Tax Paid | Tax Assessment Tax Assessment Total Assessment is a certain percentage of the fair market value that is determined by local assessors to be the total taxable value of land and additions on the property. | Land | Improvement |
|---|---|---|---|---|
| 2024 | $1,537 | $13,952 | $1,886 | $12,066 |
| 2023 | $1,537 | $13,287 | $2,472 | $10,815 |
| 2022 | $1,392 | $12,654 | $1,639 | $11,015 |
| 2021 | $1,325 | $12,052 | $1,499 | $10,553 |
| 2020 | $1,274 | $11,479 | $1,551 | $9,928 |
| 2019 | $1,190 | $10,932 | $1,572 | $9,360 |
| 2018 | $1,066 | $10,413 | $0 | $0 |
| 2017 | $1,019 | $9,915 | $721 | $9,194 |
| 2016 | $980 | $9,443 | $706 | $8,737 |
| 2015 | $976 | $8,994 | $726 | $8,268 |
| 2014 | $931 | $8,566 | $736 | $7,830 |
Source: Public Records
Map
Nearby Homes
- 4212 Bonaparte Blvd
- 8319 NE 10th St
- 4501 Meadowpark Dr
- 904 Cypress Cove
- 8517 Justin Place
- 1113 S Locust Dr
- 4613 Meadowpark Dr
- 1033 Holly Ln
- 3912 Parkwoods Ln
- 1105 N Beach Ave
- 3701 Woodside Dr
- 1304 Pinewood Ct
- 9187 NE 10th St
- 1034 Jasmine Ln
- 1016 Holly Dr
- 1036 Sycamore Dr
- 907 Leisure Dr
- 1208 Cathy Ln
- 1312 Hickory Ln
- 3803 Penny Dr
- 1125 N Saint John Ave
- 1016 Willow Brook Dr
- 1012 Willow Brook Dr
- 1020 Willow Brook Dr
- 4208 Bonaparte Blvd
- 1008 Willow Brook Dr
- 4204 Bonaparte Blvd
- 1128 N Saint John Ave
- 1126 N Saint John Ave
- 4220 Bonaparte Blvd
- 1024 Willow Brook Dr
- 4130 Bonaparte Blvd
- 4200 Bonaparte Blvd
- 4224 Bonaparte Blvd
- 1120 N Saint John Ave
- 1028 Willow Brook Dr
- 1124 N Saint John Ave
- 4126 Bonaparte Blvd
- 4300 Meadowpark Dr
- 1116 N Saint John Ave